Constants Module
Module containing the constants.
The constants module provides a set of predefined constants used in the package.
Every class derives from Domain: its members are
the values it accepts, it carries DEFAULT, and a chart front checks each value
passed for a constant-typed parameter against it before anything is drawn. A raw
string equal to a member is the member, and None always means "unset, the
default applies".
Each class and what reads it: a chart parameter, a style attribute, or the config.
Figure Constants
| CLASS | DESCRIPTION |
|---|---|
FIG_SIZE |
|
FIG_FORMAT |
|
THEME |
|
TRAIT |
|
Font Constants
| CLASS | DESCRIPTION |
|---|---|
FONT_STYLE |
The |
FONT_WEIGHT |
The |
Line Constants
| CLASS | DESCRIPTION |
|---|---|
LINE_MARKER |
|
LINE_STYLE |
|
LINE_DRAW_STYLE |
The |
ARROW_STYLE |
The |
Style Constants
| CLASS | DESCRIPTION |
|---|---|
HATCH_STYLE |
The |
COLORS |
The |
EMPHASIS |
|
Legend Constants
| CLASS | DESCRIPTION |
|---|---|
LEGEND_ALIGN |
The |
LEGEND_LOCATION |
The |
Chart Constants
| CLASS | DESCRIPTION |
|---|---|
BAR_MODE |
|
SORT |
|
COLOR_NORM |
|
ORIENTATION |
|
VIOLIN_INNER |
|
BANDWIDTH |
|
SWARM_MODE |
|
VALUE_FORMAT |
|
DATE_FORMAT |
|
SHOW_GRID |
|
AXIS_SCALE |
|
ASPECT_RATIO |
|
COLORBAR_LOCATION |
The |
DRAW_POSITION |
|
HISTOGRAM_TYPE |
The |
Chart-Specific Constants
| CLASS | DESCRIPTION |
|---|---|
STACKED_AREA_BASELINE |
|
BUMP_RANK |
|
LINE_LABEL_POSITION |
|
RADIAL_TYPE |
|
RADIAL_DIRECTION |
|
CALENDAR_WEEKDAY |
|
GANTT_DATE_PERIOD |
|
GANTT_VALUE |
|
GANTT_SORT_KEY |
|
GANTT_ARROW_ENTRY |
The |
DUMBBELL_VALUE |
|
DUMBBELL_SORT_KEY |
|
RIDGELINE_SCALE |
|
CONTOUR_LEVELS |
|
HEXBIN_REDUCE |
|
NETWORK_LAYOUT |
|
NETWORK_LABEL_POSITION |
|
SCATTER_MATRIX_DIAGONAL |
|
BASEMAP_FEATURE |
|
BASEMAP_RESOLUTION |
|
Constants by Chart
Which constants the parameters of each chart accept, by chart family. A constant used by one chart, or by one chart family, carries that chart's prefix; one shared across families carries none. Style attributes take the constants named in their typings.
Trends and Comparisons
Distributions
Relationships
Flows
| Chart | Chart-specific | Shared |
|---|---|---|
| SankeyChart | — | FIG_SIZE, VALUE_FORMAT |
Part of a Whole
| Chart | Chart-specific | Shared |
|---|---|---|
| Treemap | — | FIG_SIZE, LEGEND_ALIGN, LEGEND_LOCATION, VALUE_FORMAT |
The Domain Base
The base of every constant class: its members are the values it accepts.
A member is a plain class attribute, e.g. LINEAR = "linear", so a raw
string equal to a member is the member. Every class carries DEFAULT,
and None passes every check as "unset, the default applies".
Examples:
>>> from datachart.constants import ORIENTATION
>>> ORIENTATION.members()
('vertical', 'horizontal')
>>> ORIENTATION.check("horizontal", "orientation")
'horizontal'
Whether value is None, a member, or of an open vocabulary's form.
Return value, or raise ValueError unless the class accepts it.
| PARAMETER | DESCRIPTION |
|---|---|
value
|
The value passed for
TYPE:
|
parameter
|
The parameter's name, used in the message.
TYPE:
|
| RETURNS | DESCRIPTION |
|---|---|
Any
|
The value, unchanged. |
| RAISES | DESCRIPTION |
|---|---|
ValueError
|
If |
Figure Constants
Bases: Domain
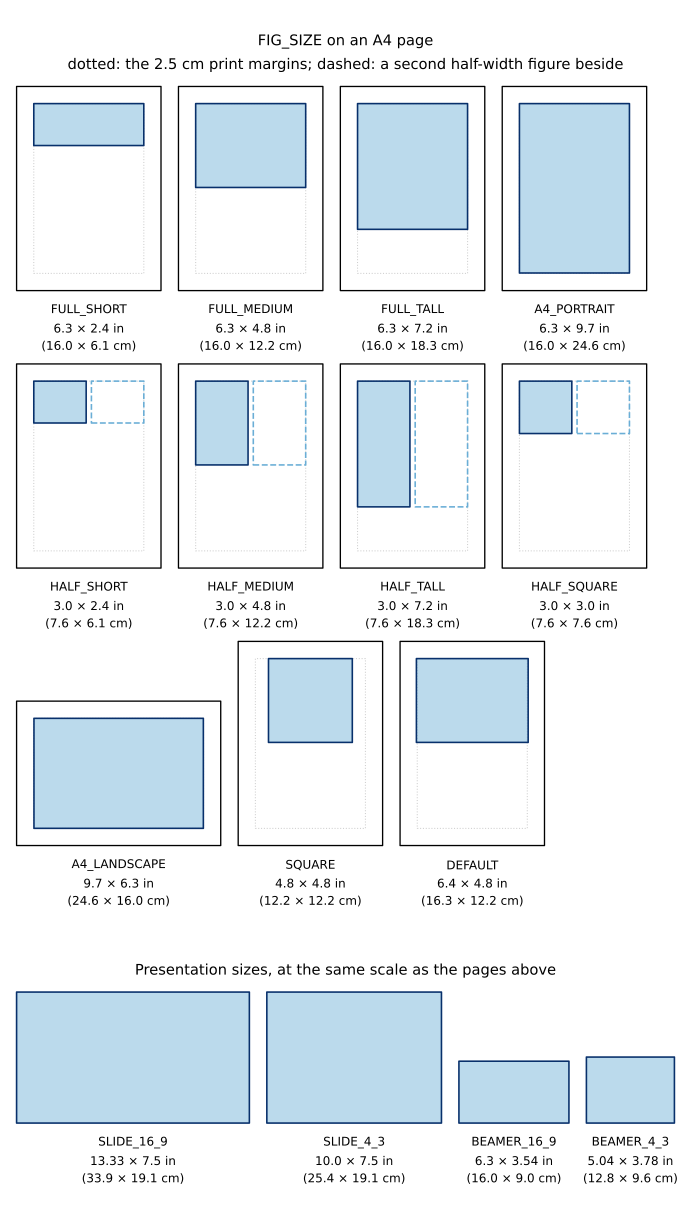
The predefined figure sizes.
All values are (width, height) in inches, matplotlib's figsize unit.
Paper figures are anchored to the printable area of an A4 page with
standard 2.5 cm margins — a 6.3 x 9.7 in (16.0 x 24.6 cm) text block.
FULL spans the text-block width; HALF spans one of two columns
separated by a 0.3 in (0.8 cm) gap (3.0 in / 7.6 cm each). Widths cross
with a height — SHORT (2.4 in / 6.1 cm), MEDIUM (4.8 in / 12.2 cm),
or TALL (7.2 in / 18.3 cm). Passed as the figsize chart setting.
Examples:
| ATTRIBUTE | DESCRIPTION |
|---|---|
DEFAULT |
The default figure size. Equals to
TYPE:
|
FULL_SHORT |
The short, full-width figure size. Equals to
TYPE:
|
FULL_MEDIUM |
The medium, full-width figure size. Equals to
TYPE:
|
FULL_TALL |
The tall, full-width figure size. Equals to
TYPE:
|
HALF_SHORT |
The short, half-width figure size. Equals to
TYPE:
|
HALF_MEDIUM |
The medium, half-width figure size. Equals to
TYPE:
|
HALF_TALL |
The tall, half-width figure size. Equals to
TYPE:
|
HALF_SQUARE |
The square, half-width figure size. Equals to
TYPE:
|
A4_PORTRAIT |
The A4 portrait printable-area figure size. Equals to
TYPE:
|
A4_LANDSCAPE |
The A4 landscape printable-area figure size. Equals to
TYPE:
|
SQUARE |
The square figure size. Equals to
TYPE:
|
SLIDE_16_9 |
The 16:9 slide figure size (PowerPoint/Google Slides). Equals to
TYPE:
|
SLIDE_4_3 |
The 4:3 slide figure size (PowerPoint/Google Slides). Equals to
TYPE:
|
BEAMER_16_9 |
The 16:9 beamer frame figure size. Equals to
TYPE:
|
BEAMER_4_3 |
The 4:3 beamer frame figure size. Equals to
TYPE:
|
Bases: Domain
The supported figure formats.
Passed as the format argument of save_figure.
Examples:
| ATTRIBUTE | DESCRIPTION |
|---|---|
DEFAULT |
The default format. Same as
TYPE:
|
SVG |
The svg format. Equals to
TYPE:
|
PDF |
The pdf format. Equals to
TYPE:
|
PNG |
The png format. Equals to
TYPE:
|
WEBP |
The webp format. Equals to
TYPE:
|
EPS |
The eps format (Encapsulated PostScript). Equals to
TYPE:
|
JPG |
The jpg format. Equals to
TYPE:
|
TIFF |
The tiff format. Equals to
TYPE:
|
Font Constants
Bases: Domain
The supported font styles.

Examples:
| ATTRIBUTE | DESCRIPTION |
|---|---|
DEFAULT |
The default font style. Same as
TYPE:
|
NORMAL |
The normal font style. Equals to
TYPE:
|
ITALIC |
The italic font style. Equals to
TYPE:
|
OBLIQUE |
The oblique font style. Equals to
TYPE:
|
Bases: Domain
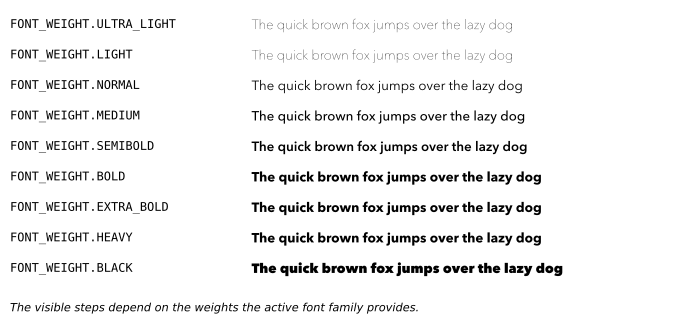
The supported font weights.
Used by the font_*_weight style attributes (general, title, subtitle,
axis labels).
Examples:
| ATTRIBUTE | DESCRIPTION |
|---|---|
DEFAULT |
The default font weight. Same as
TYPE:
|
ULTRA_LIGHT |
The ultra light font weight. Equals to
TYPE:
|
LIGHT |
The light font weight. Equals to
TYPE:
|
NORMAL |
The normal font weight. Equals to
TYPE:
|
MEDIUM |
The medium font weight. Equals to
TYPE:
|
SEMIBOLD |
The semibold font weight. Equals to
TYPE:
|
BOLD |
The bold font weight. Equals to
TYPE:
|
EXTRA_BOLD |
The extra bold font weight. Equals to
TYPE:
|
HEAVY |
The heavy font weight. Equals to
TYPE:
|
BLACK |
The black font weight. Equals to
TYPE:
|
Line Constants
Bases: Domain
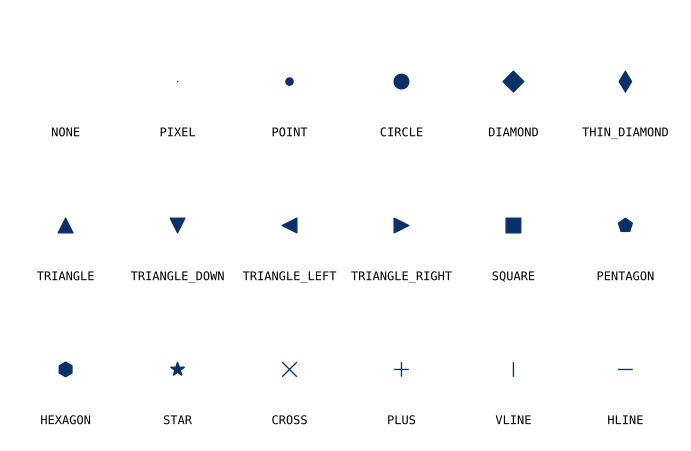
The supported line markers.
Used by the plot_line_marker (line charts) and plot_scatter_marker
(scatter charts) style attributes.
Examples:
| ATTRIBUTE | DESCRIPTION |
|---|---|
DEFAULT |
The default marker: the theme's
TYPE:
|
NO_MARKER |
No marker. Equals to
TYPE:
|
PIXEL |
The pixel line marker. Equals to
TYPE:
|
POINT |
The point line marker. Equals to
TYPE:
|
CIRCLE |
The circle line marker. Equals to
TYPE:
|
DIAMOND |
The diamond line marker. Equals to
TYPE:
|
THIN_DIAMOND |
The thin diamond line marker. Equals to
TYPE:
|
TRIANGLE |
The triangle (up) line marker. Equals to
TYPE:
|
TRIANGLE_DOWN |
The triangle down line marker. Equals to
TYPE:
|
TRIANGLE_LEFT |
The triangle left line marker. Equals to
TYPE:
|
TRIANGLE_RIGHT |
The triangle right line marker. Equals to
TYPE:
|
SQUARE |
The square line marker. Equals to
TYPE:
|
PENTAGON |
The pentagon line marker. Equals to
TYPE:
|
HEXAGON |
The hexagon line marker. Equals to
TYPE:
|
STAR |
The star line marker. Equals to
TYPE:
|
CROSS |
The cross line marker. Equals to
TYPE:
|
PLUS |
The plus line marker. Equals to
TYPE:
|
VLINE |
The vertical line marker. Equals to
TYPE:
|
HLINE |
The horizontal line marker. Equals to
TYPE:
|
Bases: Domain
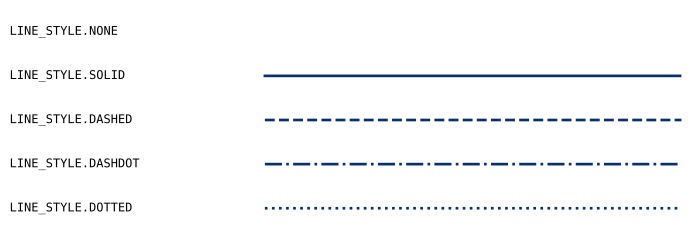
The supported line styles.
Used by the plot_line_style style attribute of line charts.
Examples:
| ATTRIBUTE | DESCRIPTION |
|---|---|
DEFAULT |
The default line style. Same as
TYPE:
|
NO_LINE |
No line. Equals to
TYPE:
|
SOLID |
The solid line style. Equals to
TYPE:
|
DASHED |
The dashed line style. Equals to
TYPE:
|
DASHDOT |
The dashdot line style. Equals to
TYPE:
|
DOTTED |
The dotted line style. Equals to
TYPE:
|
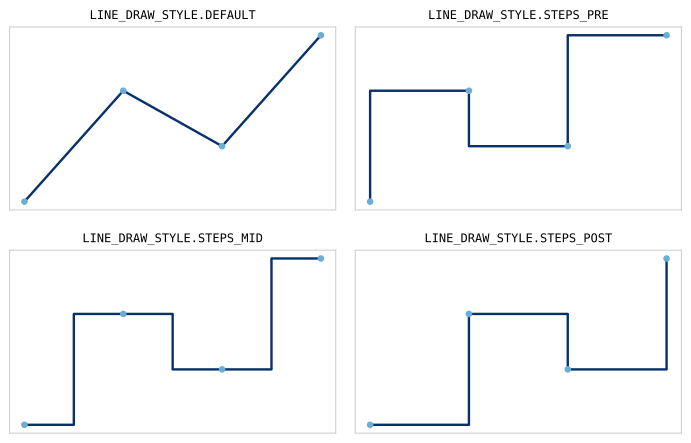
Bases: Domain
The supported line draw styles.
Used by the plot_line_drawstyle style attribute of line charts.
Examples:
| ATTRIBUTE | DESCRIPTION |
|---|---|
DEFAULT |
The default line draw style. Equals to
TYPE:
|
STEPS_PRE |
The pre-steps line draw style. Equals to
TYPE:
|
STEPS_MID |
The mid-steps line draw style. Equals to
TYPE:
|
STEPS_POST |
The post-steps line draw style. Equals to
TYPE:
|
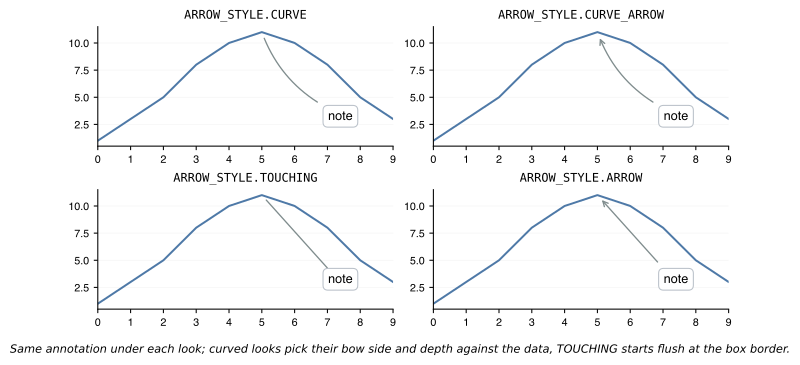
Bases: Domain
The supported connector looks.
The one constant for every drawn connector: the plot_text_arrow_style
style attribute of text annotations and the plot_network_edge_style
style attribute of network charts. Each value names a complete connector
look — the line shape, curvature, and the gap on the text side. For an
annotation, a curved look bows toward the side with the most open space
around the chart's data; plot_text_arrow_curve pins the bow exactly,
and the other plot_text_arrow_* style attributes override single
properties of the chosen look. A raw matplotlib arrow style string
(e.g. "-|>") is also accepted. A network edge takes only the two
headless looks, CURVE and STRAIGHT, bowed by
plot_network_edge_curve; its arrowhead comes from the chart's
directed argument.
Examples:
| ATTRIBUTE | DESCRIPTION |
|---|---|
DEFAULT |
The default connector look. Same as
TYPE:
|
CURVE |
A curved plain line with a small text-side gap. The default. Text annotations and network edges. Equals to
TYPE:
|
CURVE_ARROW |
The same curve with an arrowhead at the target. Text annotations only. Equals to
TYPE:
|
STRAIGHT |
A straight plain line with a small text-side gap. Text annotations and network edges. Equals to
TYPE:
|
TOUCHING |
A straight plain line starting flush at the text box border. Text annotations only. Equals to
TYPE:
|
ARROW |
A straight line with an arrowhead at the target. Text annotations only. Equals to
TYPE:
|
Style Constants
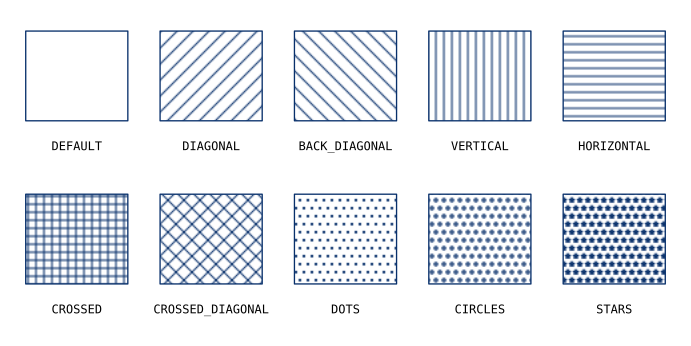
Bases: Domain
The supported hatch styles.
Used by the plot_bar_hatch and plot_hist_hatch style attributes, and
by the HATCH theme's hatch cycle.
Examples:
| ATTRIBUTE | DESCRIPTION |
|---|---|
DEFAULT |
The default hatch style. Equals to
TYPE:
|
DIAGONAL |
The diagonal hatch style. Equals to
TYPE:
|
BACK_DIAGONAL |
The back diagonal hatch style. Equals to
TYPE:
|
VERTICAL |
The vertical hatch style. Equals to
TYPE:
|
HORIZONTAL |
The horizontal hatch style. Equals to
TYPE:
|
CROSSED |
The crossed hatch style. Equals to
TYPE:
|
CROSSED_DIAGONAL |
The crossed diagonal hatch style. Equals to
TYPE:
|
DOTS |
The dots hatch style. Equals to
TYPE:
|
CIRCLES |
The circles hatch style. Equals to
TYPE:
|
STARS |
The stars hatch style. Equals to
TYPE:
|
Bases: Domain
The predefined colors using pypalettes.
All palette names are valid pypalettes identifiers. You can use any of the 2500+
palettes available in pypalettes by passing the palette name as a string.
Accepted anywhere a palette is: the color_general_singular and
color_general_multiple config attributes, and the heatmap and parallel
coords color settings. All predefined palettes are rendered in the
Colormaps guide.
A single matplotlib color ("#B5651D", "tab:blue", "rebeccapurple") is
accepted in the same places and is used as a palette of one, repeated for
every series that asks for a color. A name that is both a palette and a
color, such as "Red" or "pink", is read as the palette.
Examples:
| ATTRIBUTE | DESCRIPTION |
|---|---|
DEFAULT |
The default theme's singular palette. Same as
TYPE:
|
Blues |
Sequential blue palette. Equals to
TYPE:
|
Greens |
Sequential green palette. Equals to
TYPE:
|
Oranges |
Sequential orange palette. Equals to
TYPE:
|
Purples |
Sequential purple palette. Equals to
TYPE:
|
Reds |
Sequential red palette. Equals to
TYPE:
|
Sunset2 |
Multi-hue sunset palette. Equals to
TYPE:
|
YlGnBu |
Multi-hue yellow-green-blue palette. Equals to
TYPE:
|
YlOrRd |
Multi-hue yellow-orange-red palette. Equals to
TYPE:
|
YlOrBr |
Multi-hue yellow-orange-brown palette. Equals to
TYPE:
|
PuBuGn |
Multi-hue purple-blue-green palette. Equals to
TYPE:
|
GnBu |
Multi-hue green-blue palette. Equals to
TYPE:
|
BuPu |
Multi-hue blue-purple palette. Equals to
TYPE:
|
PuBu |
Multi-hue purple-blue palette. Equals to
TYPE:
|
Egypt |
Multi-hue Egypt palette. Equals to
TYPE:
|
Hiroshige |
Multi-hue Hiroshige palette. Equals to
TYPE:
|
Lake |
Multi-hue lake palette. Equals to
TYPE:
|
Neon |
Multi-hue neon palette. Equals to
TYPE:
|
RdBu |
Diverging red-blue palette. Equals to
TYPE:
|
BrBG |
Diverging brown-blue-green palette. Equals to
TYPE:
|
PuOr |
Diverging purple-orange palette. Equals to
TYPE:
|
Spectral |
Diverging spectral palette. Equals to
TYPE:
|
RdYlBu |
Diverging red-yellow-blue palette. Equals to
TYPE:
|
RdYlGn |
Diverging red-yellow-green palette. Equals to
TYPE:
|
Pastel |
Soft pastel categorical palette. Equals to
TYPE:
|
Set2 |
ColorBrewer Set2 categorical palette. Equals to
TYPE:
|
Accent |
ColorBrewer Accent categorical palette. Equals to
TYPE:
|
Dark2 |
ColorBrewer Dark2 categorical palette. Equals to
TYPE:
|
Paired |
ColorBrewer Paired categorical palette (high contrast). Equals to
TYPE:
|
Set1 |
ColorBrewer Set1 categorical palette (high contrast). Equals to
TYPE:
|
Greys |
Grayscale palette for monochrome visualizations. Equals to
TYPE:
|
Viridis |
Perceptually uniform, color-blind friendly. Equals to
TYPE:
|
Cividis |
Color-blind friendly (optimized for CVD). Equals to
TYPE:
|
Inferno |
Perceptually uniform, color-blind friendly. Equals to
TYPE:
|
Plasma |
Perceptually uniform, color-blind friendly. Equals to
TYPE:
|
Magma |
Perceptually uniform, color-blind friendly. Equals to
TYPE:
|
Turbo |
Rainbow-like but perceptually better. Equals to
TYPE:
|
OkabeIto |
Okabe-Ito categorical palette, color-blind safe. Equals to
TYPE:
|
OkabeIto_Black |
Okabe-Ito palette including black. Equals to
TYPE:
|
Coolwarm |
Diverging cool-warm palette. Equals to
TYPE:
|
Tab10 |
Tableau 10-color categorical palette. Equals to
TYPE:
|
Tab20 |
Tableau 20-color categorical palette. Equals to
TYPE:
|
PaperYlGnBu |
Diversified YlGnBu categorical palette for publications. Equals to
TYPE:
|
PaperAccent |
Two-color blue/red accent pair for publications. Equals to
TYPE:
|
Harbor |
Navy to sky and amber to sand in lightness steps, the harbor theme's lead. Equals to
TYPE:
|
TolMuted |
Paul Tol's muted scheme without its greens, the muted theme's lead. Equals to
TYPE:
|
Contrast |
Navy, straw, dusty rose, charcoal and grey stepped in lightness, the contrast theme's lead. Equals to
TYPE:
|
Rust |
Muted print tones with rust first, the hatch theme's lead. Equals to
TYPE:
|
Slate |
Slate blue, sand, wine, green, orchid and sky, the slate-hatch theme's lead. Equals to
TYPE:
|
Bases: Domain
The predefined themes.
Applied with config.set_theme.
Every theme applied to the same set of
charts is shown in the
Theme Gallery.
Examples:
| ATTRIBUTE | DESCRIPTION |
|---|---|
DEFAULT |
The default theme. Equals to
TYPE:
|
GREYSCALE |
The greyscale theme. Equals to
TYPE:
|
INK |
The ink theme (dark-ink accents, print-ready). Equals to
TYPE:
|
HATCH |
The hatch theme (hatch cycle, black edges, light grid). Equals to
TYPE:
|
MINIMAL |
The minimal theme (accent violet, no spines, flat bars). Equals to
TYPE:
|
MATERIAL |
The material theme (Google palette, light grid). Equals to
TYPE:
|
SKETCH |
The sketch theme (hand-drawn, xkcd-style wobble and halo,
Comic Neue font). Equals to
TYPE:
|
QUILL |
The quill theme (black ink on white paper: pen-stroked lines,
etched fills, IM Fell English font). Equals to
TYPE:
|
HARBOR |
The harbor theme (navy and amber in lightness steps,
colour-blind safe). Equals to
TYPE:
|
MUTED |
The muted theme (Tol's muted colours, dash and marker
cycles, colour-blind safe). Equals to
TYPE:
|
CONTRAST |
The contrast theme (lightness-stepped colours plus
hatches, print-safe). Equals to
TYPE:
|
MUTEDHATCH |
The muted-hatch theme (Tol's muted colours under
hatches, BuPu value scale). Equals to
TYPE:
|
SLATEHATCH |
The slate-hatch theme (the hatch theme without rust,
slate blue first, PuBu value scale). Equals to
TYPE:
|
DARK |
The dark theme (bright marks on a near-black page, light
furniture, Viridis value scale). Equals to
TYPE:
|
Bases: Domain
The traits a derived theme composes.
A trait changes how marks are drawn and nothing about the furniture;
derive_theme applies the traits it is
given in order, after the lead and before any overrides. The predefined
harbor, muted, contrast, hatch, muted-hatch and slate-hatch themes are
built this way; the Themes guide
shows the recipe.
Examples:
>>> from datachart.constants import COLORS, THEME, TRAIT
>>> from datachart.themes import derive_theme
>>> theme = derive_theme(THEME.MINIMAL, lead=COLORS.TolMuted, traits=[TRAIT.PATTERNED])
| ATTRIBUTE | DESCRIPTION |
|---|---|
DEFAULT |
No trait; the base's marks as they are.
TYPE:
|
FLAT |
No bar, histogram or band edges, opaque bars, 2 pt lines. Equals to
TYPE:
|
EDGED |
Black edges on bars and histograms, opaque bars. Equals to
TYPE:
|
HATCHED |
Edged, plus one hatch per bar series and a 0.8 pt bar edge. Equals to
TYPE:
|
OUTLINED |
Black outlines on every other mark: bands, nodes, tiles, points,
bodies, annotation boxes, arrows and the heatmap frame. Equals to
TYPE:
|
PATTERNED |
A dash cycle for lines and a marker cycle for points. Equals to
TYPE:
|
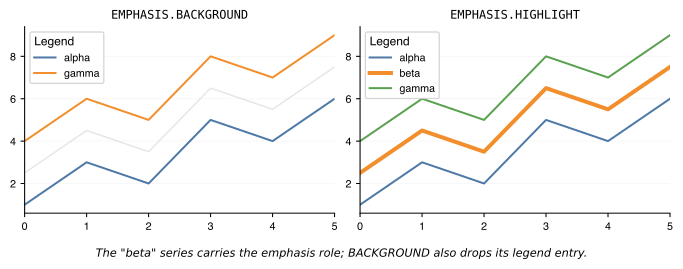
Bases: Domain
The supported emphasis roles.
Set per chart via the emphasis key in a charts list, or per figure via
the emphasis argument of Panel.
Examples:
| ATTRIBUTE | DESCRIPTION |
|---|---|
DEFAULT |
No emphasis role; the chart draws in its normal colors. Equals to
TYPE:
|
BACKGROUND |
Mute a series into context: theme muted color, lowered
alpha, thinner strokes, behind the others, no legend entry.
Equals to
TYPE:
|
HIGHLIGHT |
Bold a series and bring it to the front of the data
layers; it keeps its color and legend entry. Equals to
TYPE:
|
Legend Constants
Bases: Domain
The supported legend alignments.
Used by the plot_legend_alignment style attribute; aligns the legend's
title and entries against each other.

Examples:
| ATTRIBUTE | DESCRIPTION |
|---|---|
DEFAULT |
The default legend alignment. Same as
TYPE:
|
CENTER |
The center legend alignment. Equals to
TYPE:
|
RIGHT |
The right legend alignment. Equals to
TYPE:
|
LEFT |
The left legend alignment. Equals to
TYPE:
|
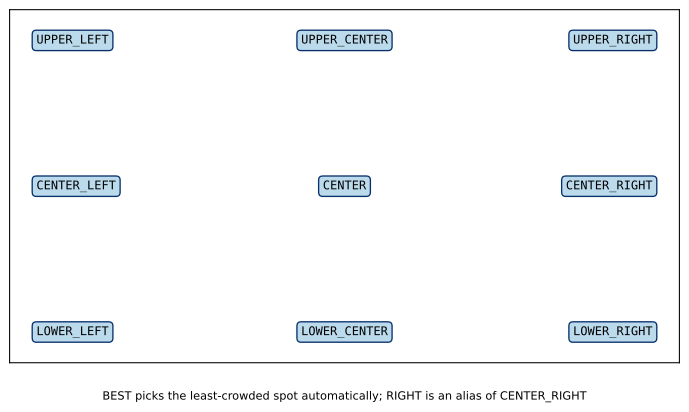
Bases: Domain
The supported legend locations.
Used by the plot_legend_location style attribute and the location
field of a chart's legend setting. The in-axes members place the legend
within the chart; the OUTSIDE_* members place it beside the axes, on the
named edge, with nothing clipped.
Examples:
| ATTRIBUTE | DESCRIPTION |
|---|---|
DEFAULT |
The default legend location. Same as
TYPE:
|
BEST |
Automatic best location. Equals to
TYPE:
|
UPPER_RIGHT |
Upper right corner. Equals to
TYPE:
|
UPPER_LEFT |
Upper left corner. Equals to
TYPE:
|
LOWER_LEFT |
Lower left corner. Equals to
TYPE:
|
LOWER_RIGHT |
Lower right corner. Equals to
TYPE:
|
RIGHT |
Center right. Equals to
TYPE:
|
CENTER_LEFT |
Center left. Equals to
TYPE:
|
CENTER_RIGHT |
Center right. Equals to
TYPE:
|
LOWER_CENTER |
Lower center. Equals to
TYPE:
|
UPPER_CENTER |
Upper center. Equals to
TYPE:
|
CENTER |
Center. Equals to
TYPE:
|
OUTSIDE_RIGHT |
Beside the right edge, top-aligned. Equals to
TYPE:
|
OUTSIDE_LEFT |
Beside the left edge, top-aligned. Equals to
TYPE:
|
OUTSIDE_TOP |
Above the axes, centered. Equals to
TYPE:
|
OUTSIDE_BOTTOM |
Below the axes, centered. Equals to
TYPE:
|
Chart Constants
Constants several charts share.
Bases: Domain
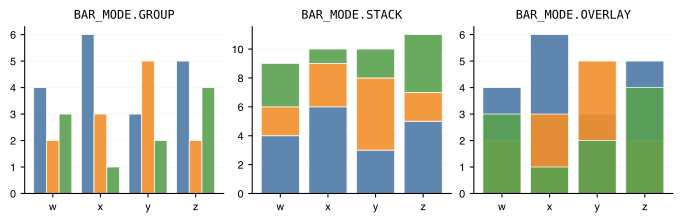
The supported bar modes.
Passed as the bar_mode setting of bar charts, histograms, and
Panel: how multiple series share the axis.
Bar charts and panels default to GROUP; histograms default to STACK,
and treat GROUP (which has no histogram meaning) as OVERLAY.
Examples:
| ATTRIBUTE | DESCRIPTION |
|---|---|
DEFAULT |
The default bar mode. Same as
TYPE:
|
GROUP |
The series are drawn side by side. Equals to
TYPE:
|
STACK |
The series are stacked on top of each other. Equals to
TYPE:
|
OVERLAY |
The series are drawn over each other at the same position. Equals to
TYPE:
|
Bases: Domain
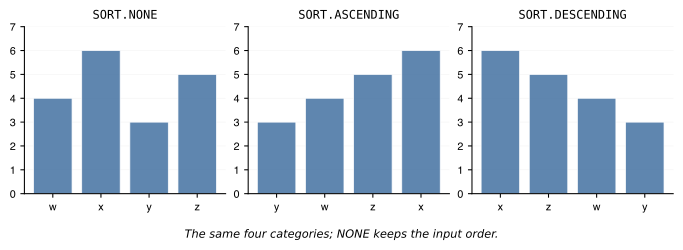
The supported category sort orders.
Passed as the sort setting of the bar-type fronts (BarChart,
PyramidChart, and the RadialChart bar visual): the order the
categories are drawn in, by value. One order serves every series in the
chart, keyed by the total across them or by the series sort_by names;
ties keep input order.
Examples:
| ATTRIBUTE | DESCRIPTION |
|---|---|
DEFAULT |
The default sort. Same as
TYPE:
|
NONE |
Input order. Equals to
TYPE:
|
ASCENDING |
Smallest value first. Equals to
TYPE:
|
DESCENDING |
Largest value first. Equals to
TYPE:
|
Bases: Domain
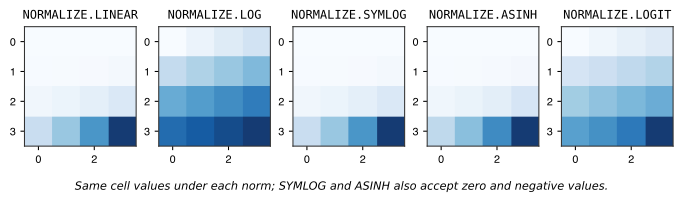
The supported normalization options.
Passed as the norm attribute of a colormapped chart: normalizes the values
before they are mapped to colors. Distinct from
AXIS_SCALE, which sets an axis scale.
Examples:
| ATTRIBUTE | DESCRIPTION |
|---|---|
DEFAULT |
The default normalization. Same as
TYPE:
|
LINEAR |
The linear normalization. Equals to
TYPE:
|
LOG |
The logistic normalization. Equals to
TYPE:
|
SYMLOG |
The symlog normalization. Equals to
TYPE:
|
ASINH |
The asinh normalization. Equals to
TYPE:
|
LOGIT |
The logit normalization. Equals to
TYPE:
|
CENTERED |
The normalization holding
TYPE:
|
TWOSLOPE |
The normalization holding
TYPE:
|
CENTERED and TWOSLOPE are read by the heatmap, calendar heatmap,
contour chart and hexbin chart, which draw them in the theme's diverging
colormap; the other charts taking a norm support the first five.
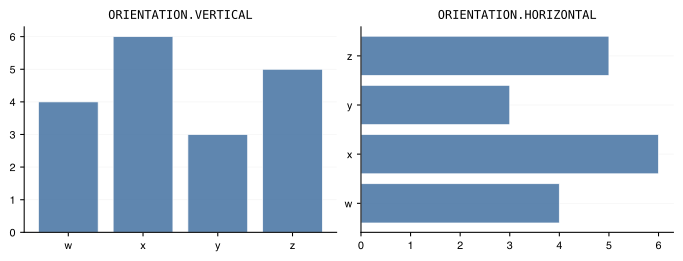
Bases: Domain
The supported orientations.
Passed as the orientation setting of bar charts, histograms, box
plots, and violin plots.
Examples:
| ATTRIBUTE | DESCRIPTION |
|---|---|
DEFAULT |
The default orientation. Same as
TYPE:
|
HORIZONTAL |
The horizontal orientation. Equals to
TYPE:
|
VERTICAL |
The vertical orientation. Equals to
TYPE:
|
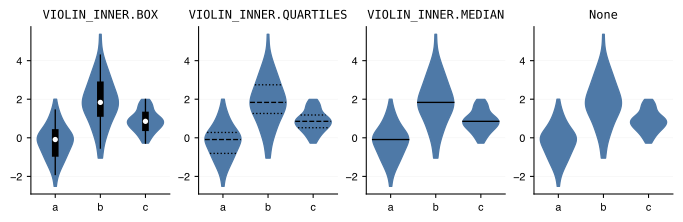
Bases: Domain
The supported violin inner marks.
Passed as the inner setting of violin and ridgeline plots. On a violin
plot None takes the theme's default; on a ridgeline plot it draws no
marks.
Examples:
| ATTRIBUTE | DESCRIPTION |
|---|---|
DEFAULT |
The violin plot's inner marks when the theme sets none.
Same as
TYPE:
|
BOX |
A thin quartile bar, a 1.5·IQR whisker line, and a median
dot. Equals to
TYPE:
|
QUARTILES |
A dashed median line and dotted first and third
quartile lines, clipped to the body. Equals to
TYPE:
|
MEDIAN |
A single solid median line clipped to the body. Equals
to
TYPE:
|
NO_INNER |
No inner marks, the body alone. Equals to
TYPE:
|
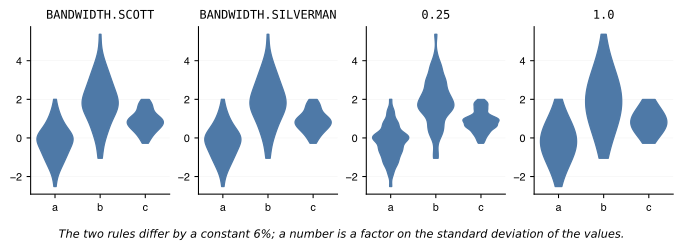
Bases: Domain
The supported kernel density bandwidth rules.
Passed as the bandwidth setting of violin plots: the rule of thumb that
sizes the Gaussian kernel. A number is also accepted, as a factor applied
to the standard deviation of the values — smaller is sharper, larger is
smoother.
Examples:
| ATTRIBUTE | DESCRIPTION |
|---|---|
DEFAULT |
The default rule. Same as
TYPE:
|
SCOTT |
Scott's rule of thumb,
TYPE:
|
SILVERMAN |
Silverman's rule of thumb,
TYPE:
|
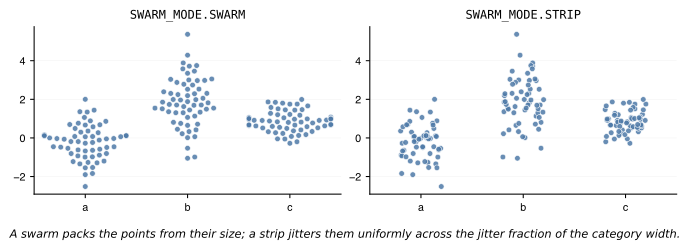
Bases: Domain
The supported swarm plot modes.
Passed as the swarm_mode setting of swarm plots: how the points of one
group spread across the category width.
Examples:
| ATTRIBUTE | DESCRIPTION |
|---|---|
DEFAULT |
The default mode. Same as
TYPE:
|
SWARM |
The beeswarm mode: non-overlapping offsets computed from
the marker size. Equals to
TYPE:
|
STRIP |
The strip mode: seeded uniform jitter. Equals to
TYPE:
|
Bases: Domain
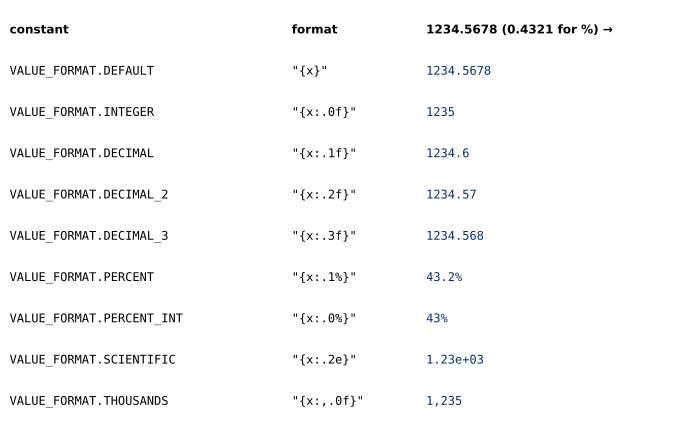
The predefined value formats.
Passed as the value_format attribute of every chart that takes
show_values: the value labels printed beside its marks, or the values
drawn in a heatmap's cells.
Examples:
| ATTRIBUTE | DESCRIPTION |
|---|---|
DEFAULT |
The default value format. Equals to
TYPE:
|
INTEGER |
The integer value format (works on floats too). Equals to
TYPE:
|
DECIMAL |
The decimal value format (1 decimal place). Equals to
TYPE:
|
DECIMAL_2 |
The decimal value format (2 decimal places). Equals to
TYPE:
|
DECIMAL_3 |
The decimal value format (3 decimal places). Equals to
TYPE:
|
PERCENT |
The percentage value format (1 decimal place). Equals to
TYPE:
|
PERCENT_INT |
The percentage value format (no decimals). Equals to
TYPE:
|
SCIENTIFIC |
The scientific notation format. Equals to
TYPE:
|
THOUSANDS |
The thousands separator format. Equals to
TYPE:
|
Bases: Domain
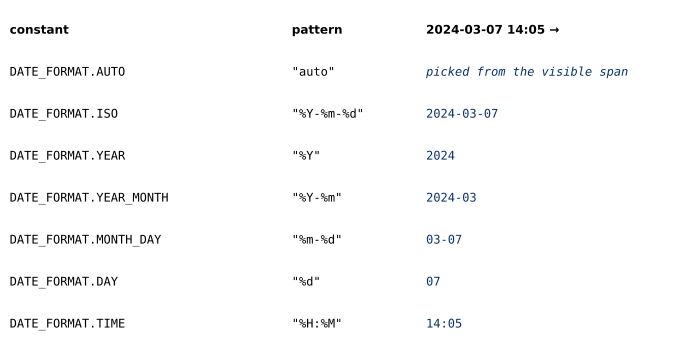
The predefined date formats.
Passed as the xticks_format or yticks_format attribute of a chart
whose axis holds datetime values, to label its ticks. Every member but
AUTO is a strftime pattern; any other pattern is accepted as well.
On a time axis AUTO picks concise, non-repeating labels for the visible
span; on a category axis with date labels it prints the ISO date, plus
the time when any label carries one.
Examples:
| ATTRIBUTE | DESCRIPTION |
|---|---|
DEFAULT |
The default date format. Same as
TYPE:
|
AUTO |
Pick the labels from the visible span: concise, non-repeating. Equals to
TYPE:
|
ISO |
The ISO 8601 date. Equals to
TYPE:
|
YEAR |
The four-digit year. Equals to
TYPE:
|
YEAR_MONTH |
The year and month. Equals to
TYPE:
|
MONTH_DAY |
The month and day. Equals to
TYPE:
|
DAY |
The day of the month. Equals to
TYPE:
|
TIME |
The hour and minute. Equals to
TYPE:
|
Bases: Domain
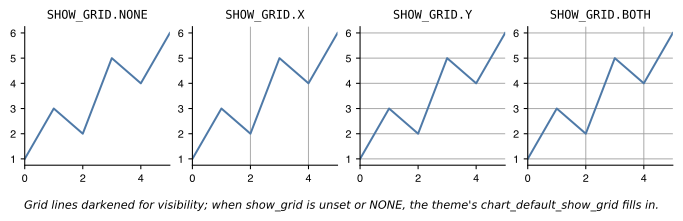
The supported show grid options.
Passed as the show_grid chart setting: which grid lines to draw. When
unset (or NONE), the theme's chart_default_show_grid fills in. The
members name a set to draw, so there is no member for "no grid at all":
pass False for that.
Examples:
| ATTRIBUTE | DESCRIPTION |
|---|---|
DEFAULT |
The default show grid. Same as
TYPE:
|
NONE |
No explicit grid; the theme default applies. Equals to
TYPE:
|
X |
Show the x-axis grid. Equals to
TYPE:
|
Y |
Show the y-axis grid. Equals to
TYPE:
|
BOTH |
Show both the x- and y-axis grid. Equals to
TYPE:
|
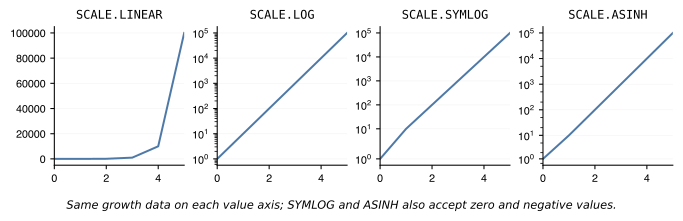
Bases: Domain
The supported scale options.
Passed as the scalex/scaley chart settings to set an axis scale.
Distinct from COLOR_NORM, which
normalizes heatmap colors.
Examples:
| ATTRIBUTE | DESCRIPTION |
|---|---|
DEFAULT |
The default scale. Same as
TYPE:
|
LINEAR |
The linear scale. Equals to
TYPE:
|
LOG |
The log scale. Equals to
TYPE:
|
SYMLOG |
The symlog scale. Equals to
TYPE:
|
ASINH |
The asinh scale. Equals to
TYPE:
|
Bases: Domain
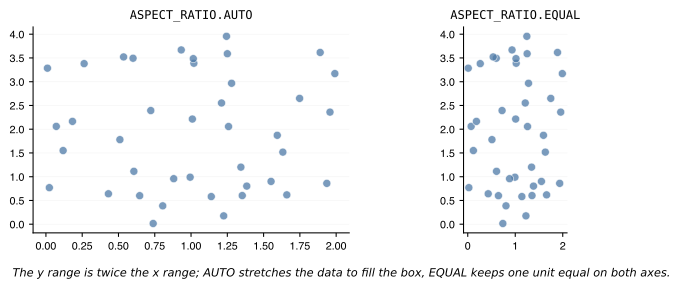
The supported aspect ratio options.
Passed as the aspect_ratio chart setting: the ratio of the y-unit to
the x-unit on screen.
Examples:
| ATTRIBUTE | DESCRIPTION |
|---|---|
DEFAULT |
The default aspect ratio. Same as
TYPE:
|
AUTO |
Automatic aspect ratio. Equals to
TYPE:
|
EQUAL |
Equal aspect ratio (1:1). Equals to
TYPE:
|
GEOGRAPHIC |
Longitude on x and latitude on y at true
proportions: one degree of longitude is narrowed by the cosine
of the latitude in the middle of the y-axis. The y-axis must
stay within -90 and 90. Equals to
TYPE:
|
Bases: Domain
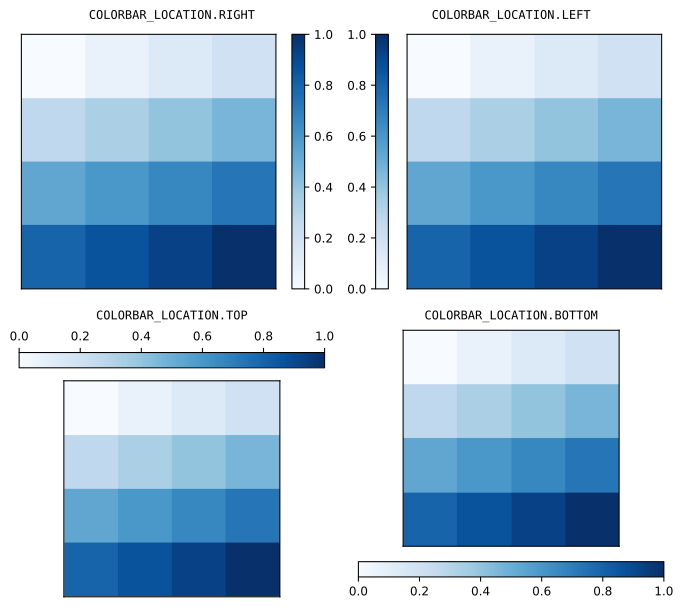
The supported colorbar locations.
Used by the location field of a chart's colorbar setting
(ColorbarSettingAttrs): the chart edge the bar sits on.
Examples:
| ATTRIBUTE | DESCRIPTION |
|---|---|
DEFAULT |
The default location of a vertical colorbar. Same as
TYPE:
|
RIGHT |
Right side of the chart. Equals to
TYPE:
|
LEFT |
Left side of the chart. Equals to
TYPE:
|
TOP |
Top of the chart. Equals to
TYPE:
|
BOTTOM |
Bottom of the chart. Equals to
TYPE:
|
Bases: Domain
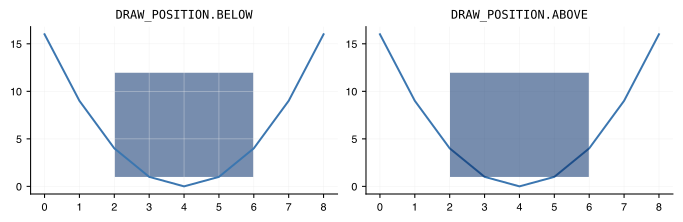
The supported draw positions of the image and basemap.
Passed as the position setting of the image chart and the basemap
chart: where the picture or the map sits in the draw order of the axes
it shares with other charts. The position decides it, never the order
of the figures in Panel.
Examples:
| ATTRIBUTE | DESCRIPTION |
|---|---|
DEFAULT |
The default position. Same as
TYPE:
|
BELOW |
Under every mark and under the gridlines, so the grid and
the data read over the picture. Equals to
TYPE:
|
ABOVE |
Over the marks, under the reference lines and the text
annotations; a watermark or a mask. Equals to
TYPE:
|
Chart-Specific Constants
Constants one chart or one chart family owns, in the order of the charts reference.
Bases: Domain
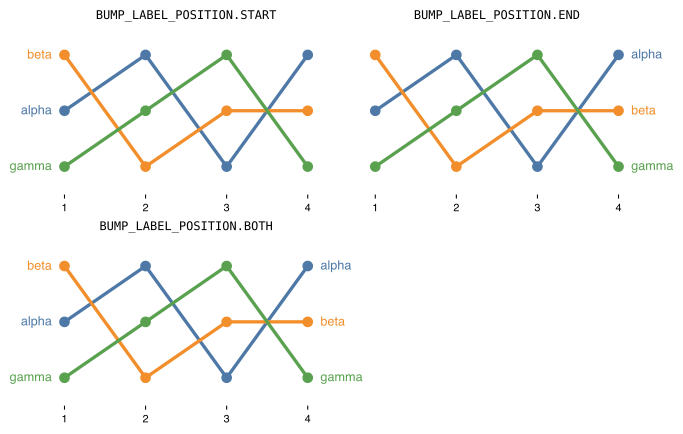
The supported end label positions.
Passed as the label_position setting of the line, stacked area and bump
charts: beside which end of each line its series label prints.
Examples:
| ATTRIBUTE | DESCRIPTION |
|---|---|
DEFAULT |
The default position. Same as
TYPE:
|
START |
Beside the first point. Equals to
TYPE:
|
END |
Beside the last point. Equals to
TYPE:
|
BOTH |
Beside the first and the last point. Equals to
TYPE:
|
Bases: Domain
The supported stacked area baselines.
Passed as the baseline attribute of stacked area charts: where the
first series starts, and so how the whole stack sits on the y-axis.
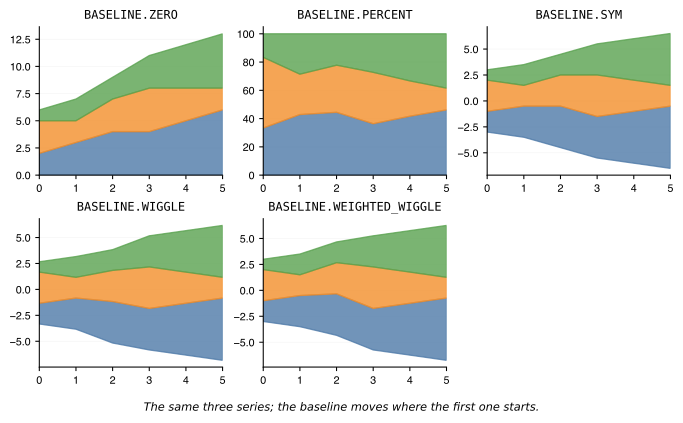
Examples:
| ATTRIBUTE | DESCRIPTION |
|---|---|
DEFAULT |
The default baseline. Same as
TYPE:
|
ZERO |
The stack starts at zero. Equals to
TYPE:
|
PERCENT |
Each
TYPE:
|
SYM |
The stack is centred on zero. Equals to
TYPE:
|
WIGGLE |
The baseline minimises the sum of squared slopes. Equals to
TYPE:
|
WEIGHTED_WIGGLE |
The baseline minimises the size-weighted sum of squared slopes. Equals to
TYPE:
|
Bases: Domain
The supported bump chart ranking rules.
Passed as the rank_by setting of the bump chart: whether each series'
y is already a rank or a value ranked per period, over the series
present there. Ties keep input order.
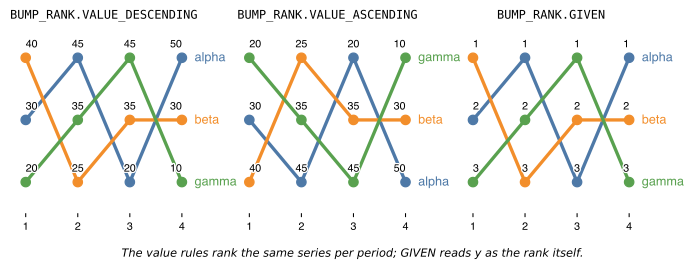
Examples:
| ATTRIBUTE | DESCRIPTION |
|---|---|
DEFAULT |
The default ranking. Same as
TYPE:
|
VALUE_DESCENDING |
The highest value ranks first. Equals to
TYPE:
|
VALUE_ASCENDING |
The lowest value ranks first. Equals to
TYPE:
|
GIVEN |
TYPE:
|
Bases: Domain
The supported radial chart visuals.
Passed as the type setting of radial charts: the mark family the whole
figure draws. The area visual is the line visual with show_area=True;
stacked bars are the bar visual with bar_mode="stack".
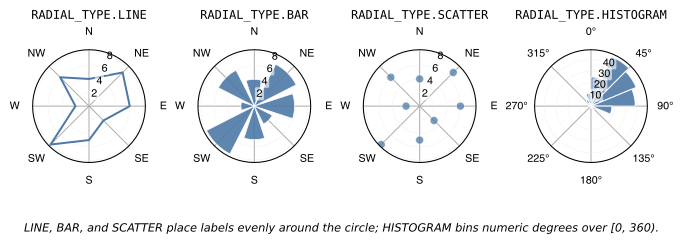
Examples:
| ATTRIBUTE | DESCRIPTION |
|---|---|
DEFAULT |
The default visual. Same as
TYPE:
|
LINE |
The line (radar) visual. Equals to
TYPE:
|
BAR |
The bar visual, one sector per label. Equals to
TYPE:
|
SCATTER |
The scatter visual. Equals to
TYPE:
|
HISTOGRAM |
The angular histogram (wind rose) visual. Equals to
TYPE:
|
Bases: Domain
The supported angular directions.
Passed as the direction setting of radial charts: which way the angles
increase around the circle.
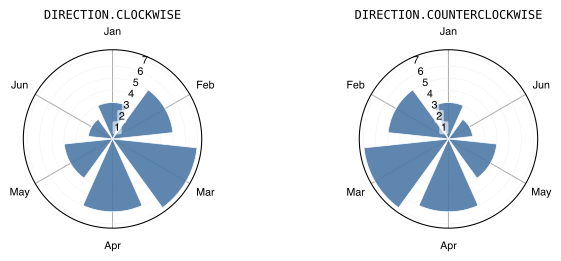
Examples:
| ATTRIBUTE | DESCRIPTION |
|---|---|
DEFAULT |
The default direction. Same as
TYPE:
|
CLOCKWISE |
The angles increase clockwise. Equals to
TYPE:
|
COUNTERCLOCKWISE |
The angles increase counterclockwise. Equals to
TYPE:
|
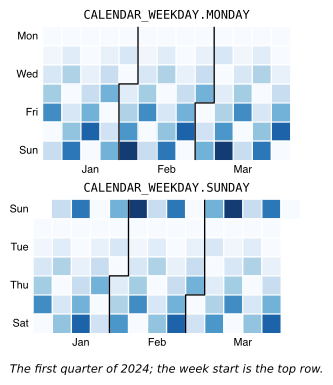
Bases: Domain
The supported week start days.
Passed as the week_start setting of the calendar heatmap: the weekday
drawn in the top row of every week column. The theme's
chart_default_calendar_heatmap_week_start supplies the default.
Examples:
| ATTRIBUTE | DESCRIPTION |
|---|---|
DEFAULT |
The default week start. Same as
TYPE:
|
MONDAY |
Weeks run from Monday to Sunday. Equals to
TYPE:
|
SUNDAY |
Weeks run from Sunday to Saturday. Equals to
TYPE:
|
Bases: Domain
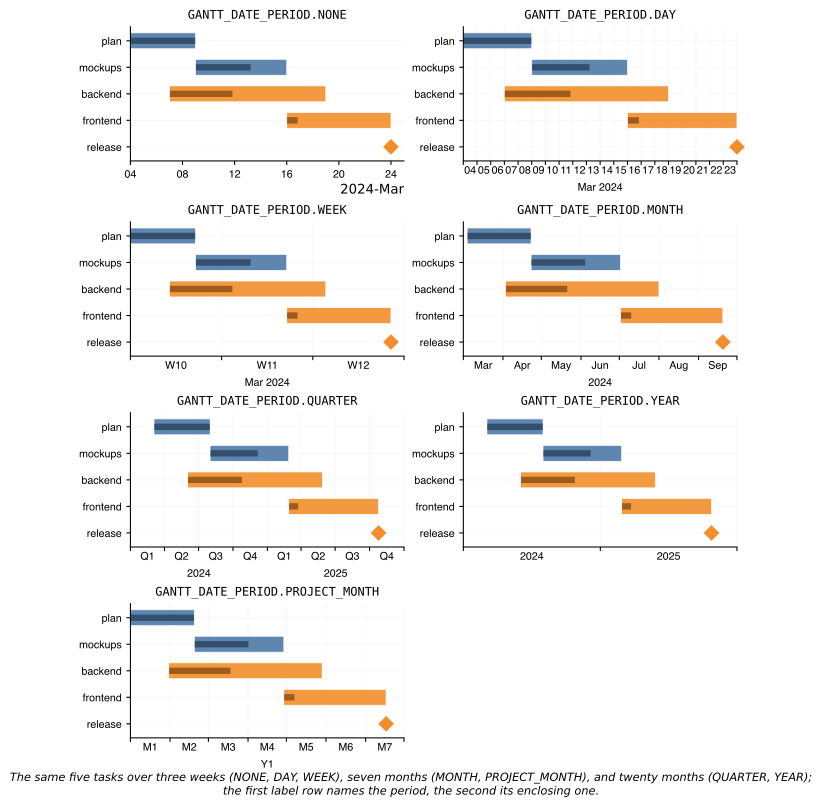
The supported date axis periods.
Passed as the period setting of the gantt chart: the calendar period
the date axis is divided into. Lines mark the period edges, each period
is labelled at its centre, and a second row names the enclosing period.
Examples:
| ATTRIBUTE | DESCRIPTION |
|---|---|
DEFAULT |
The default period: concise date ticks. Same as
TYPE:
|
NONE |
Concise date ticks, no period edges. Equals to
TYPE:
|
DAY |
Days, under their month. Equals to
TYPE:
|
WEEK |
ISO weeks starting on Monday, under their month. Equals to
TYPE:
|
MONTH |
Months, under their year. Equals to
TYPE:
|
QUARTER |
Quarters, under their year. Equals to
TYPE:
|
YEAR |
Years. Equals to
TYPE:
|
PROJECT_MONTH |
Months counted from the project start, M1, M2, …,
under their project year, Y1, Y2, …. The start is
TYPE:
|
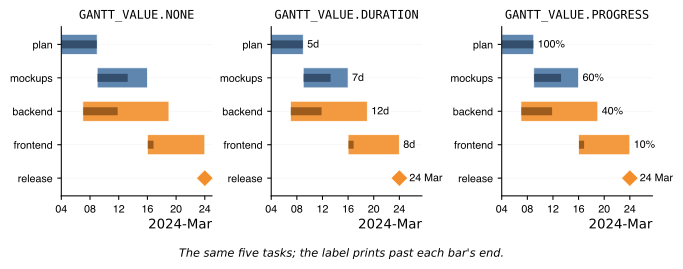
Bases: Domain
The supported gantt chart value labels.
Passed as the value_kind setting of the gantt chart: what each bar
prints past its end when show_values is on.
Examples:
| ATTRIBUTE | DESCRIPTION |
|---|---|
DEFAULT |
The default label. Same as
TYPE:
|
NONE |
Equals to
TYPE:
|
DURATION |
The task's duration in days. Equals to
TYPE:
|
PROGRESS |
The task's progress as a percentage. Equals to
TYPE:
|
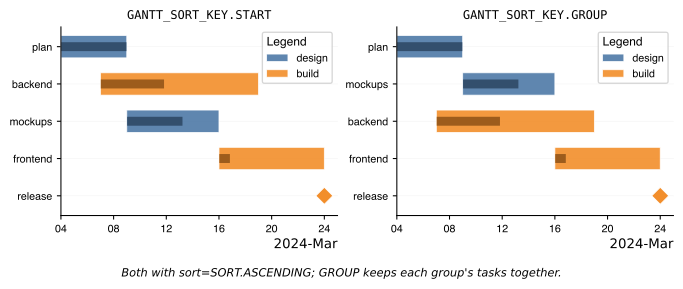
Bases: Domain
The supported gantt chart sort keys.
Passed as the sort_by setting of the gantt chart: what a sort other
than SORT.NONE orders the task rows by.
Examples:
| ATTRIBUTE | DESCRIPTION |
|---|---|
DEFAULT |
The default key. Same as
TYPE:
|
START |
Every row by its start. Equals to
TYPE:
|
GROUP |
Rows clustered by group, groups by their earliest start
and tasks within a group by start. Equals to
TYPE:
|
Bases: Domain
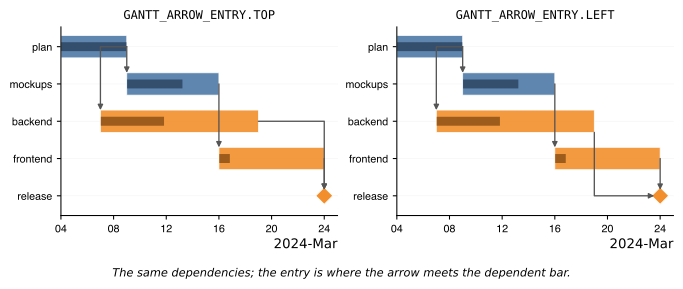
The supported gantt dependency arrow entries.
Passed as the plot_gantt_dependency_entry style attribute of the gantt
chart: which side of the dependent task a dependency arrow enters.
Examples:
| ATTRIBUTE | DESCRIPTION |
|---|---|
DEFAULT |
The default entry. Same as
TYPE:
|
TOP |
Along the dependency's row, then down (or up) onto the
dependent bar's start. Equals to
TYPE:
|
LEFT |
Down (or up) from the dependency's end, then into the
dependent bar's start from the left. Equals to
TYPE:
|
Bases: Domain
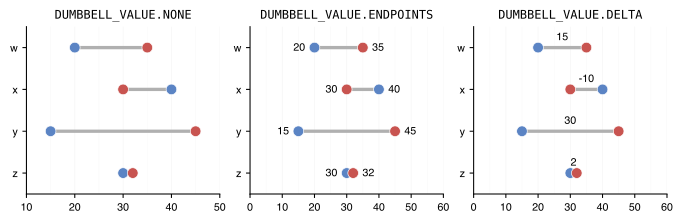
The supported dumbbell chart value labels.
Passed as the value_kind setting of the dumbbell chart: what each
record prints when show_values is on.
Examples:
| ATTRIBUTE | DESCRIPTION |
|---|---|
DEFAULT |
The default label. Same as
TYPE:
|
NONE |
Equals to
TYPE:
|
ENDPOINTS |
Each endpoint's value, past its dot, away from the
connector. Equals to
TYPE:
|
DELTA |
The record's
TYPE:
|
Bases: Domain
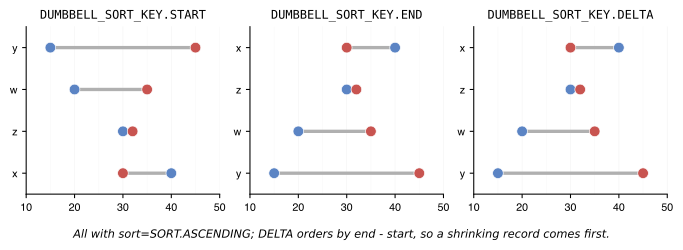
The supported dumbbell chart sort keys.
Passed as the sort_by setting of the dumbbell chart: what a sort
other than SORT.NONE orders the categories by.
Examples:
| ATTRIBUTE | DESCRIPTION |
|---|---|
DEFAULT |
The default key. Same as
TYPE:
|
START |
Each category by its
TYPE:
|
END |
Each category by its
TYPE:
|
DELTA |
Each category by its
TYPE:
|
Bases: Domain
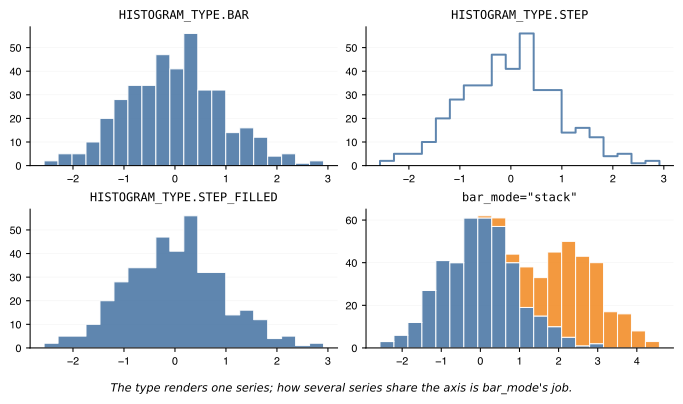
The supported histogram types.
Passed as the plot_hist_type style attribute of histograms: how each
series is rendered. How multiple series share the axis is the bar_mode
setting's job — see BAR_MODE.
Examples:
| ATTRIBUTE | DESCRIPTION |
|---|---|
DEFAULT |
The default histogram type. Same as
TYPE:
|
BAR |
The bar histogram style. Equals to
TYPE:
|
STEP |
The step histogram style: an unfilled outline in the
series color. Stacked series draw as
TYPE:
|
STEP_FILLED |
The filled step histogram style. Equals to
TYPE:
|
Bases: Domain
The supported ridgeline density scales.
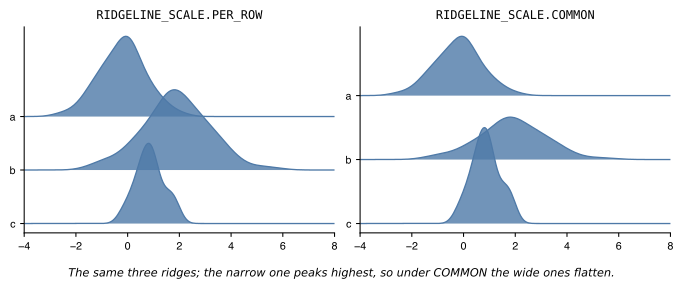
Passed as the ridge_scale setting of ridgeline plots: whether every ridge
is scaled to the same peak height, so their shapes compare, or all
ridges share one density scale, so their heights compare.
Examples:
| ATTRIBUTE | DESCRIPTION |
|---|---|
DEFAULT |
The default scale. Same as
TYPE:
|
PER_ROW |
Every ridge reaches the same peak height. Equals to
TYPE:
|
COMMON |
One density scale: the tallest ridge reaches the peak
height and the others stay in proportion. Equals to
TYPE:
|
Bases: Domain
The supported contour level rules.
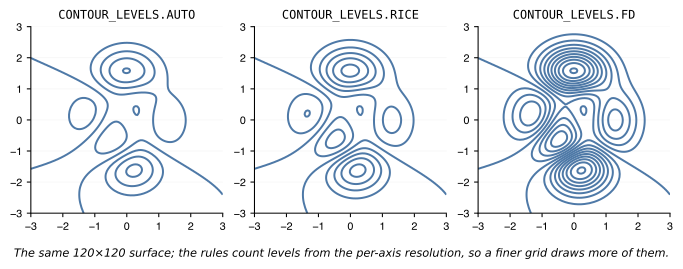
Passed as the levels setting of contour charts: the rule that picks how
many iso-lines (or filled bands) cut the surface. An integer target count
or an explicit list of level values is also accepted. Every rule is
evaluated on the per-axis resolution of the grid (the square root of its
cell count), so a finer grid draws more levels; the count is clamped to
the 4–20 range and snapped to round values.
Examples:
| ATTRIBUTE | DESCRIPTION |
|---|---|
DEFAULT |
The default rule. Same as
TYPE:
|
AUTO |
Matplotlib's own choice, about eight round values across
the surface. Equals to
TYPE:
|
RICE |
The Rice rule,
TYPE:
|
FD |
The Freedman–Diaconis rule, the value range over
TYPE:
|
Bases: Domain
The supported hexbin aggregations.
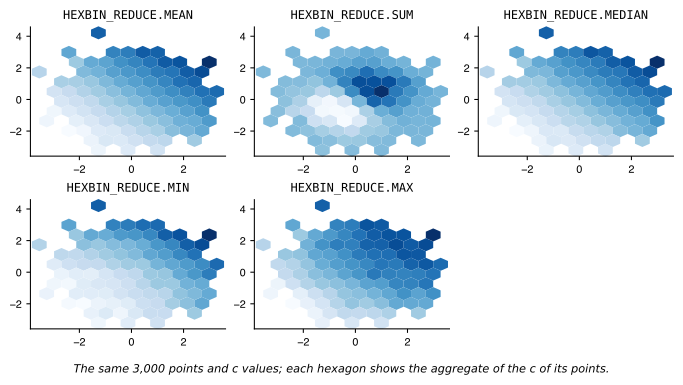
Passed as the reduce attribute of hexbin charts: how the c values of
the points in a hexagon collapse into the one value that colors it.
Ignored without c, where every hexagon shows its point count.
Examples:
| ATTRIBUTE | DESCRIPTION |
|---|---|
DEFAULT |
The default aggregation. Same as
TYPE:
|
MEAN |
The mean of the
TYPE:
|
SUM |
The sum of the
TYPE:
|
MEDIAN |
The median of the
TYPE:
|
MIN |
The smallest
TYPE:
|
MAX |
The largest
TYPE:
|
Bases: Domain
The supported network chart layouts.
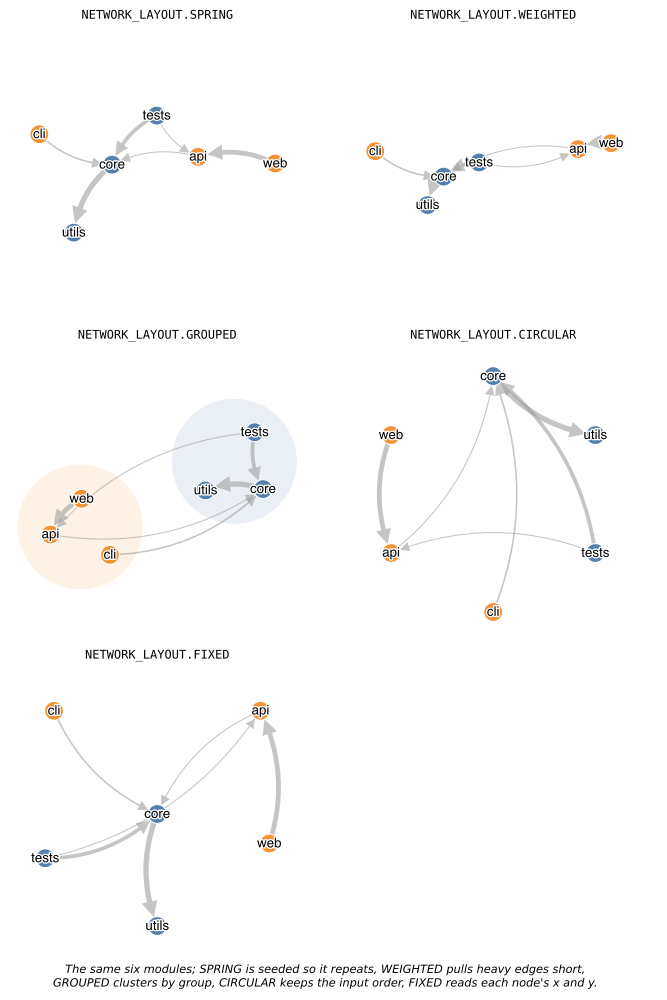
Passed as the layout attribute of network charts: the rule that places
the nodes in the 0–1 layout space. Layout changes what the picture
means, so it is a chart attribute and not a style key.
Examples:
Under WEIGHTED, and between the groups of GROUPED, an edge of weight
\(w\) pulls its nodes together at \(s(w)\) times the SPRING pull:
The lightest edge pulls at a tenth, the heaviest at three times, the rest
linearly between; an edge without a weight pulls as the lightest. With no
weights, or all equal, every edge pulls at one and the picture is the
SPRING picture.
| ATTRIBUTE | DESCRIPTION |
|---|---|
DEFAULT |
The default layout. Same as
TYPE:
|
SPRING |
A force-directed (Fruchterman–Reingold) layout: linked
nodes pull together, every pair pushes apart. Seeded by the chart's
TYPE:
|
WEIGHTED |
The spring layout with each edge's pull set by its
weight, as above: heavy edges draw their nodes close, light ones
let them drift. Same cost as
TYPE:
|
GROUPED |
The nodes clustered by their
TYPE:
|
CIRCULAR |
The nodes evenly spaced on a circle in input order,
starting at the top. Equals to
TYPE:
|
FIXED |
Each node at its own
TYPE:
|
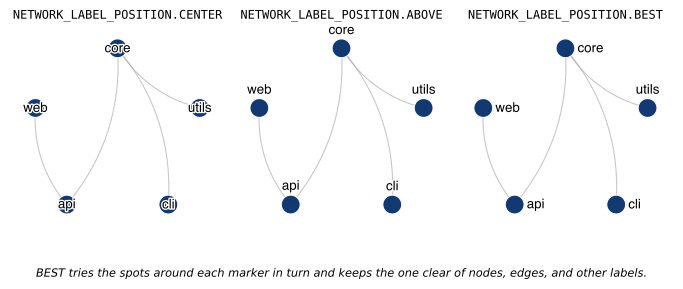
Bases: Domain
The supported node label positions.
Passed as the label_position setting of the network chart: where each
node's name prints against its marker.
Examples:
>>> from datachart.constants import NETWORK_LABEL_POSITION
>>> NETWORK_LABEL_POSITION.DEFAULT
"center"
| ATTRIBUTE | DESCRIPTION |
|---|---|
DEFAULT |
The default position. Same as
TYPE:
|
CENTER |
On the marker. Equals to
TYPE:
|
ABOVE |
Above the marker, clear of it, like a place name on a map.
Equals to
TYPE:
|
BEST |
Beside the marker, at the spot with the least overlap
with other nodes, edges, and labels, as scatter point labels are
placed. Equals to
TYPE:
|
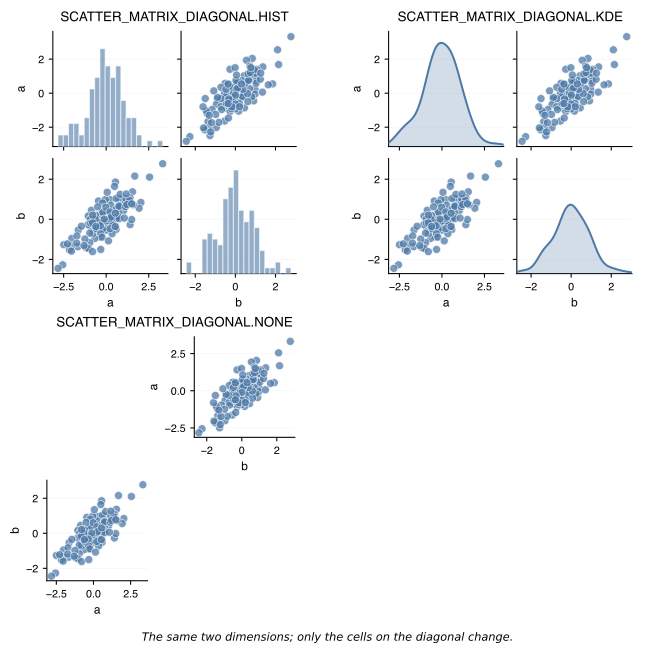
Bases: Domain
The supported scatter matrix diagonal cells.
Passed as the diagonal setting of the scatter matrix: what each
dimension's own cell shows.
Examples:
>>> from datachart.constants import SCATTER_MATRIX_DIAGONAL
>>> SCATTER_MATRIX_DIAGONAL.DEFAULT
"hist"
| ATTRIBUTE | DESCRIPTION |
|---|---|
DEFAULT |
The default diagonal. Same as
TYPE:
|
HIST |
A histogram of the dimension, one per hue group.
Equals to
TYPE:
|
KDE |
A kernel density curve of the dimension, one per hue
group. Equals to
TYPE:
|
BLANK |
A blank cell. Equals to
TYPE:
|
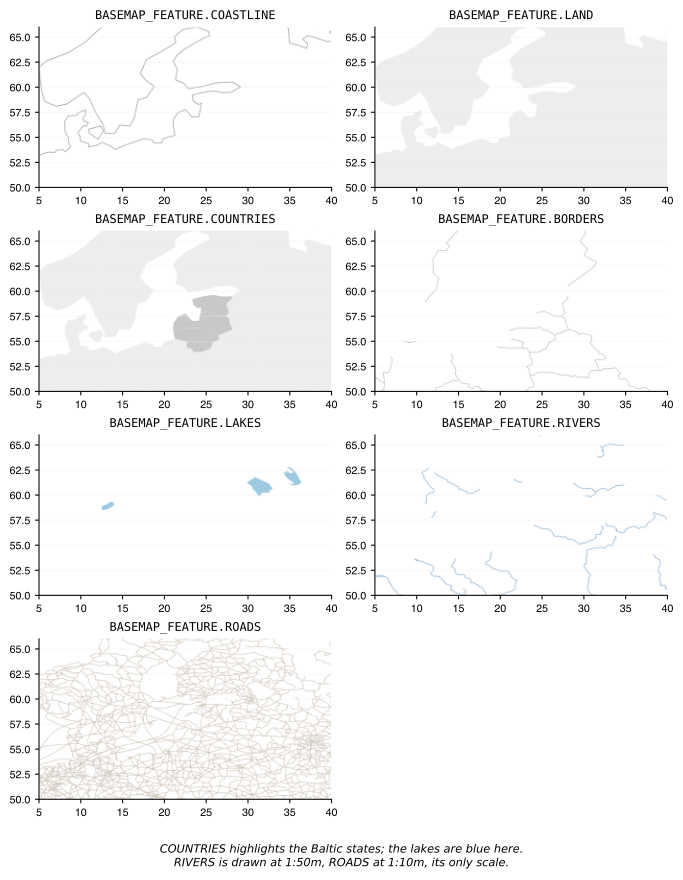
Bases: Domain
The supported basemap features.
Passed as the features of the basemap chart: which of the Natural
Earth outlines are drawn. The ocean is not a feature; it is the axes
background the land sits on. Every feature is drawn at every
BASEMAP_RESOLUTION except the roads, which Natural Earth publishes at
1:10 million alone.
Examples:
>>> from datachart.constants import BASEMAP_FEATURE
>>> BASEMAP_FEATURE.DEFAULT
("coastline", "land")
| ATTRIBUTE | DESCRIPTION |
|---|---|
DEFAULT |
The default features. Same as
TYPE:
|
COASTLINE |
The coastlines, as lines. Equals to
TYPE:
|
LAND |
The land, as a filled area. Equals to
TYPE:
|
COUNTRIES |
The land, one filled area per country, so the
TYPE:
|
BORDERS |
The land borders between countries, as lines. Equals
to
TYPE:
|
LAKES |
The large lakes, filled with the axes background.
Equals to
TYPE:
|
RIVERS |
The rivers and the centerlines of the lakes they run
through, as lines. At 1:110 million only the largest are a few
strokes across a continent; a country wants a finer scale. Equals
to
TYPE:
|
ROADS |
The main roads, as lines; 1:10 million only, about 50 MB
on first use. Natural Earth maps North America and Europe in more
detail than the rest of the world. Equals to
TYPE:
|
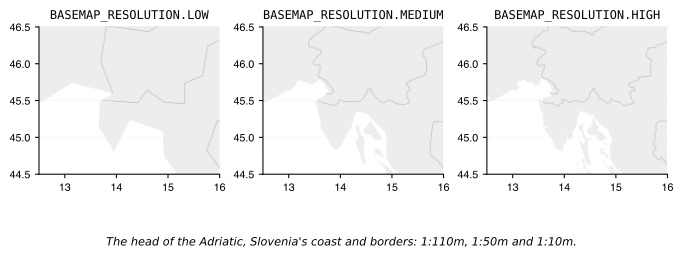
Bases: Domain
The supported basemap outline resolutions.
Passed as the resolution of the basemap chart: the Natural Earth scale
the outlines are drawn at. Each feature is downloaded the first time it
is asked for at a scale and kept in a local cache, so a map needs the
network once and never again. The cache folder is DATACHART_CACHE_DIR
when that environment variable is set, else datachart under
XDG_CACHE_HOME or ~/.cache; a machine without the network works from
a copy of a warm one.
Examples:
| ATTRIBUTE | DESCRIPTION |
|---|---|
DEFAULT |
The default resolution. Same as
TYPE:
|
LOW |
1:110 million, under 1 MB on first use; a continent or a
region. Equals to
TYPE:
|
MEDIUM |
1:50 million, about 5 MB on first use; a country.
Equals to
TYPE:
|
HIGH |
1:10 million, about 28 MB on first use, and 50 MB more
for the roads; a coast or a city's surroundings. Equals to
TYPE:
|