Styling
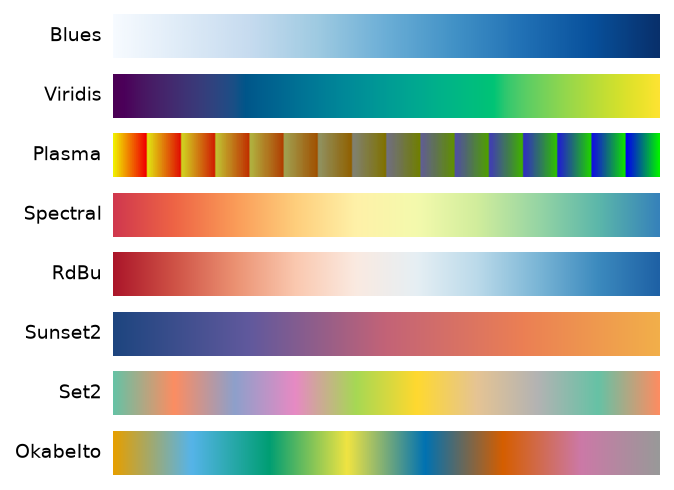
The styling guides cover everything that controls how charts look: the predefined themes and how to apply, build, and share your own through the config singleton, and the available colormaps. Each card names a guide, says what it covers, and links to it.
-
Applying the predefined themes, what a theme controls, and building and sharing your own, shown on a neon noir theme.
-
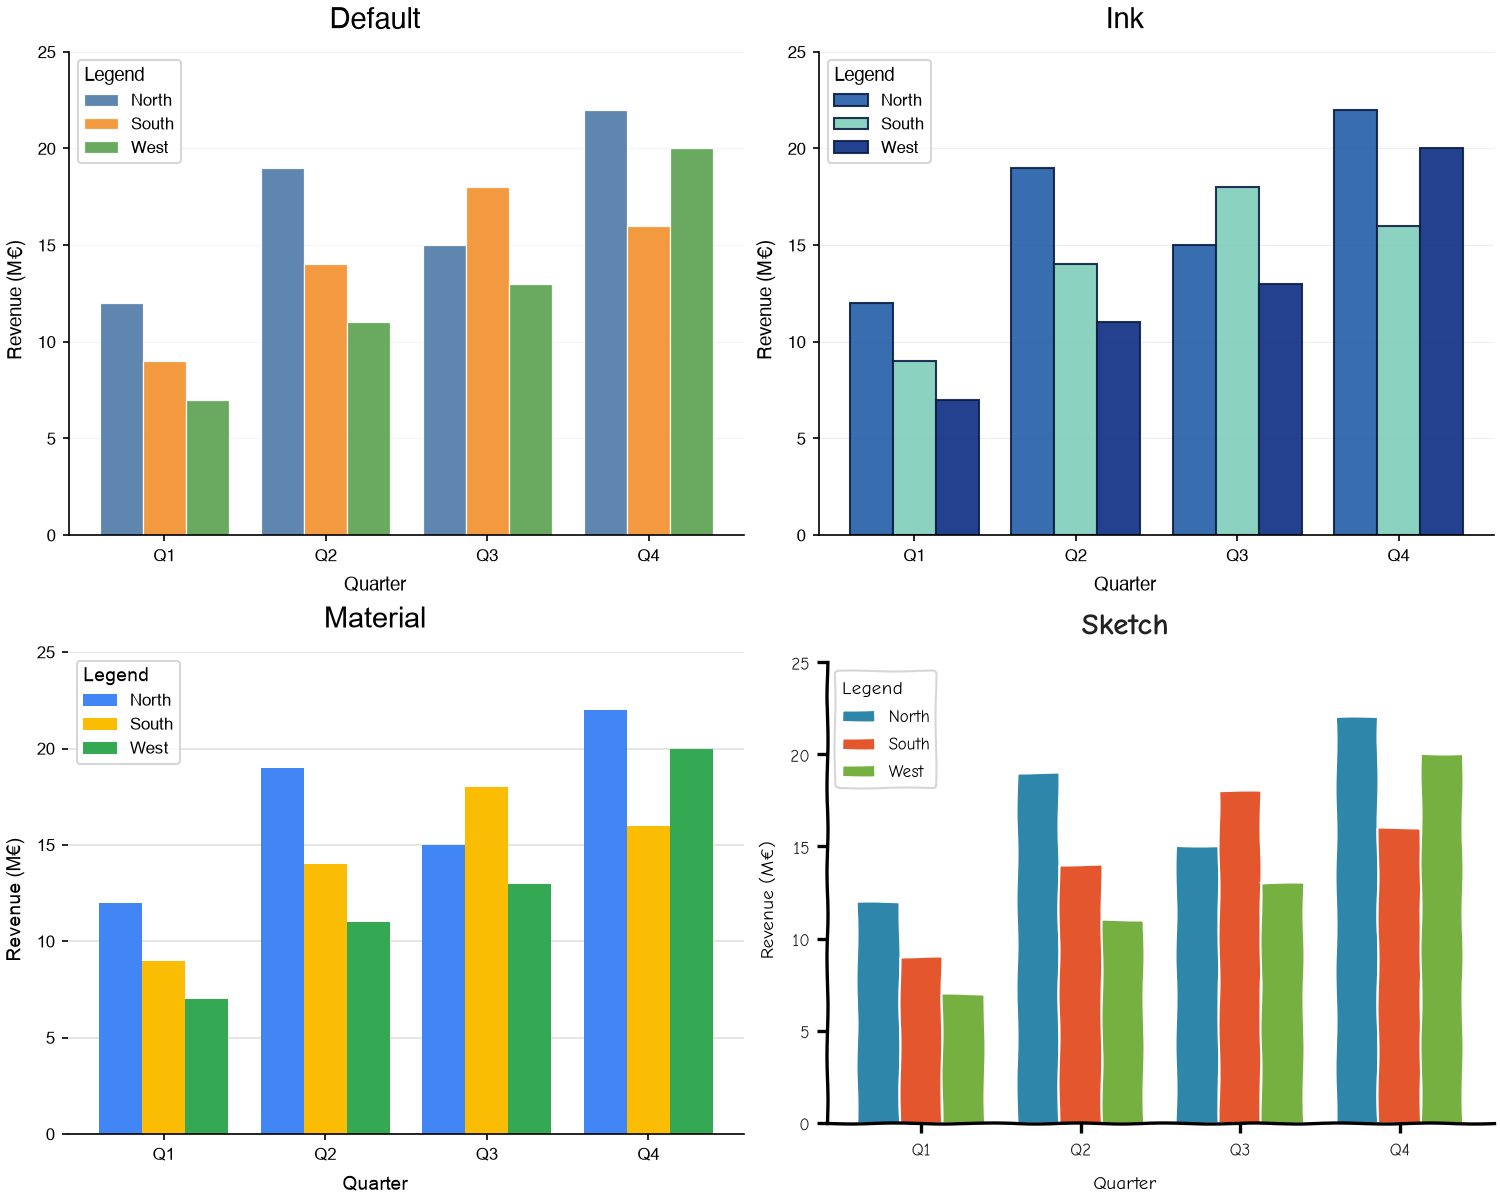
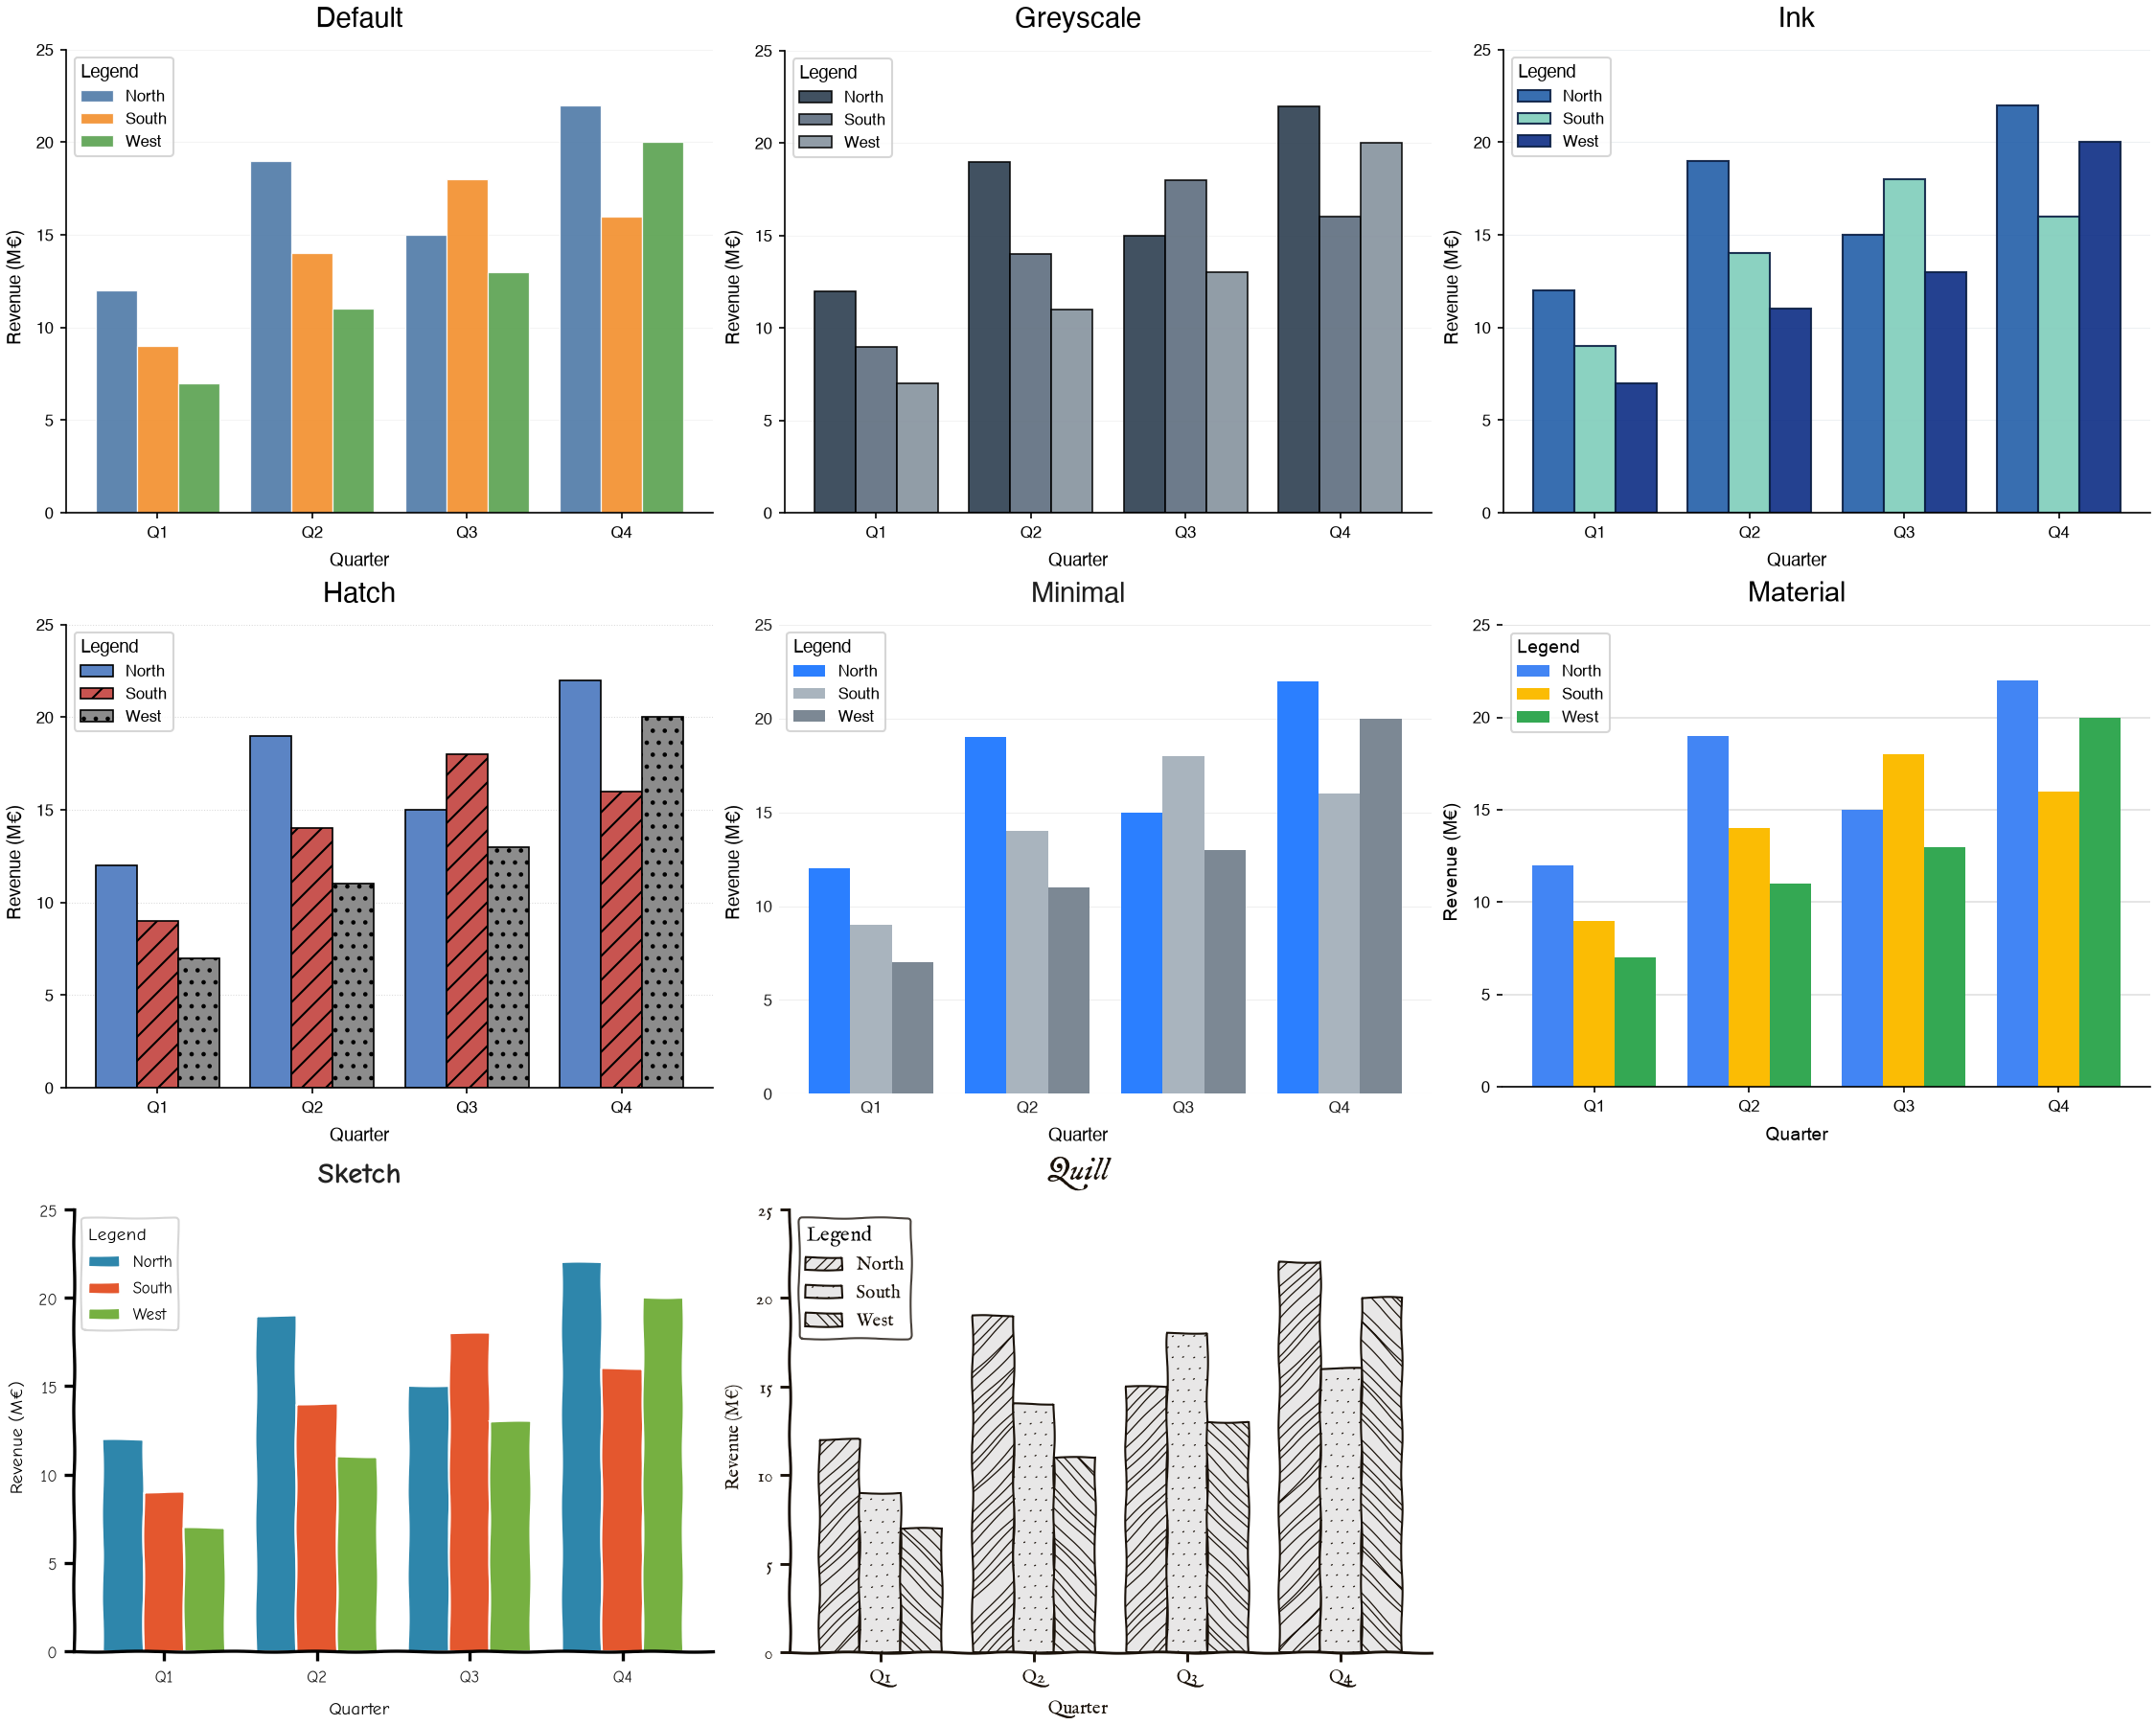
Every predefined theme as a card of color swatches with hex codes and six signature charts, grouped by use, to pick one by eye.
-
Every
COLORSpalette by kind, with the predefined themes that use it, and which kind fits which theme attribute.