Utility
The utilities of the datachart.utils module around a figure: the numbers behind the charts, getting a figure out to where it is read, and inspecting it while it is still on screen. Each card names a guide, says what it is for, and links to it.
-
The numbers behind the charts, in datachart.utils.stats: centers, spreads, correlations, fits, intervals, smoothers and densities, each shown feeding back into a chart's title, error bars, or an overlaid series.
-
Writes a figure to disk through datachart.utils.save_figure: the format, resolution and background for a manuscript, a slide, and a web page, in one call or several at once.
-
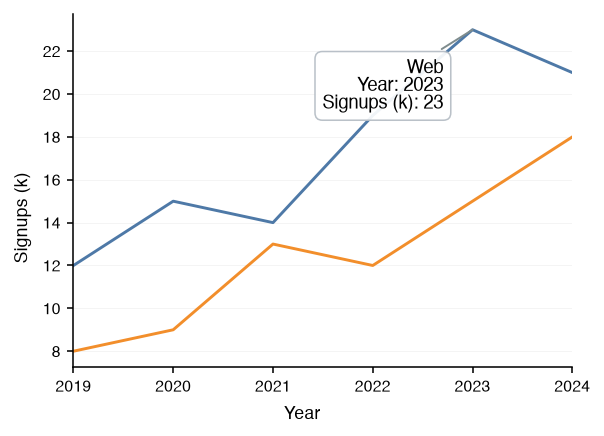
Shows a figure with zoom, pan, and hover over its marks through the
interactiveflag of every figure'sshow()method, to read the point behind an outlier or check a value without labelling it.