Composition
The composition functions of the datachart.utils module take figures already drawn by the chart functions and draw them again: overlaid in one coordinate space, side by side in a grid, or with annotations added. Each card names a guide, says what it is for, and links to it.
-
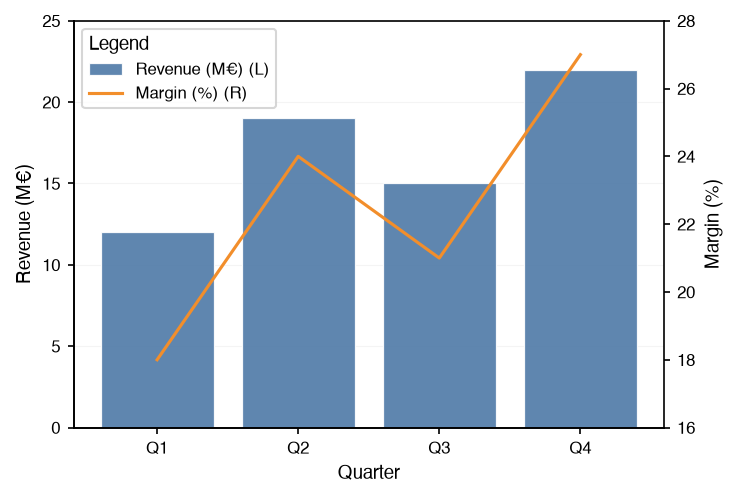
Overlays several charts in one coordinate space, with a shared x-axis and up to two y-axes, through datachart.utils.Panel.
-
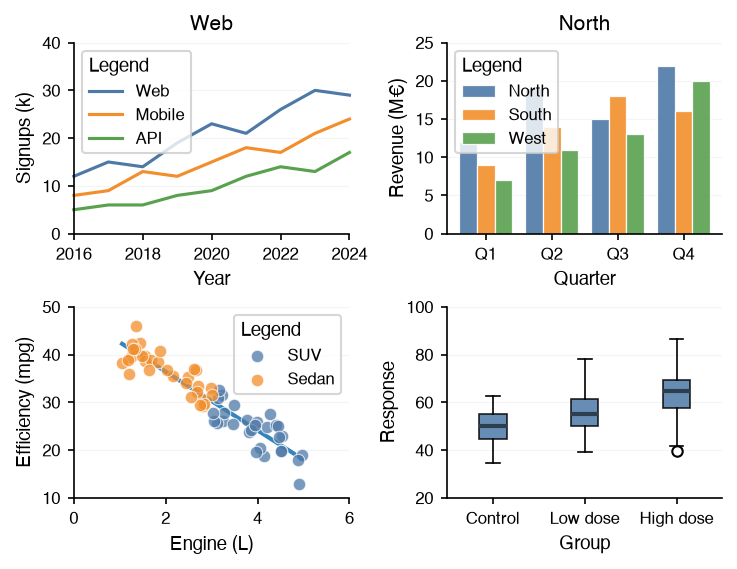
Arranges several charts in the cells of one figure, with nested rows for the layout, through datachart.utils.Grid.
-
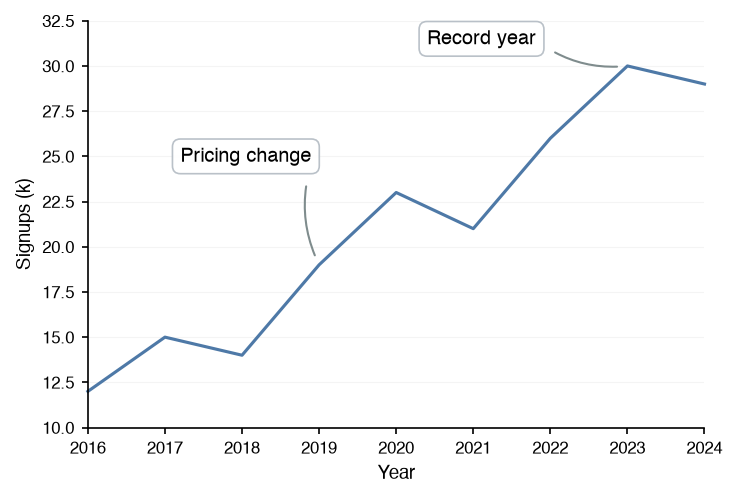
Attaches text, boxes, and connectors to a chart through its
textsparameter, or to a finished figure through datachart.utils.Annotate.